有没有一种方法可以保证从NetworkX输出分层结果?

105

我正在尝试生成一个树形结构的流程图。我已经使用networkx创建了代表性图形,但我需要一种方法在输出绘图时显示树形结构。我使用matplotlib.pylab来绘制图形。

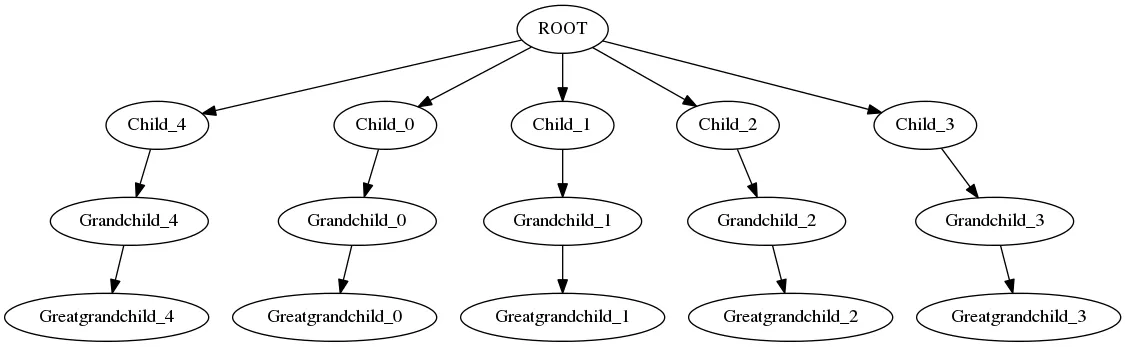
我需要展示类似于这里所示的结构。尽管我没有子图。

如何保证像那样的结构?

以下是一些例子:

Various NetworkX layouts

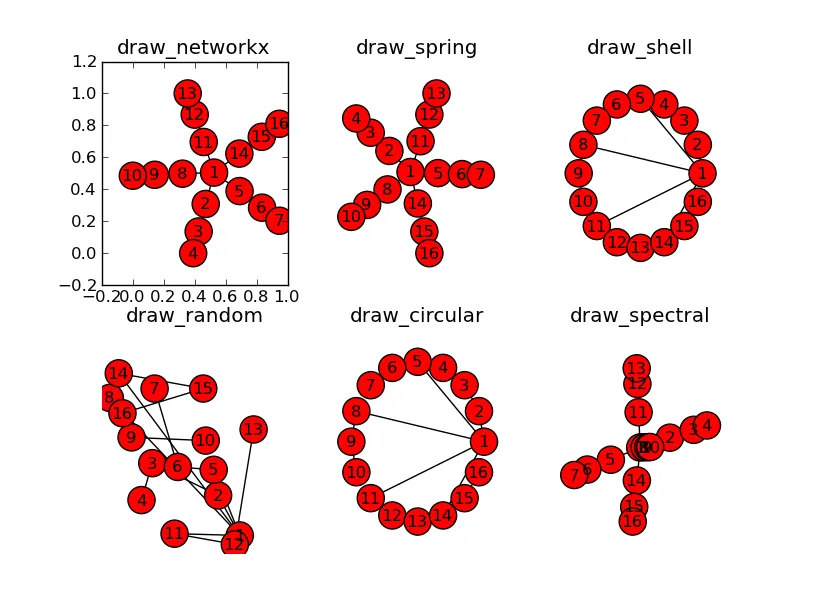
我已经能够使用pylab和graphviz显示图形,但它们都没有提供我想要的树形结构。我尝试过networkx提供的所有布局,但它们都没有显示出层次结构。我不确定需要给它哪些选项/模式或者是否需要使用权重。任何建议都会非常有帮助。

@jterrace:

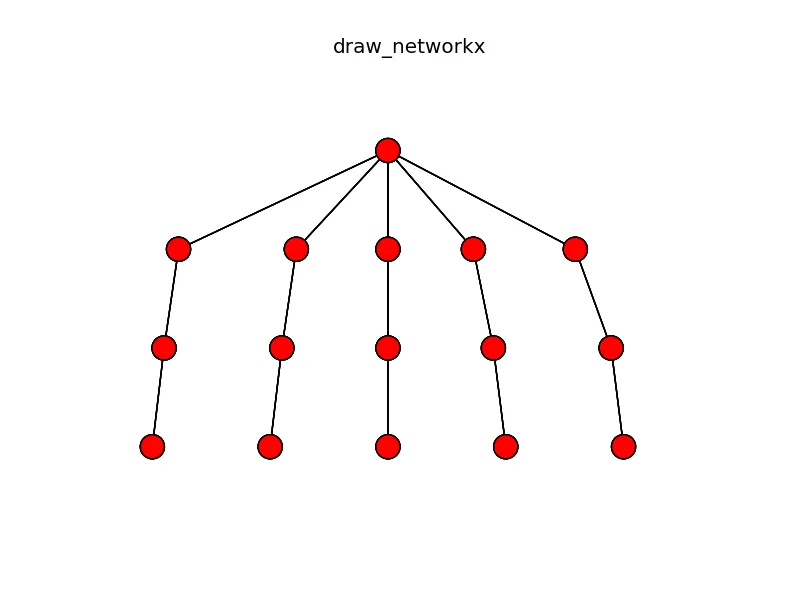
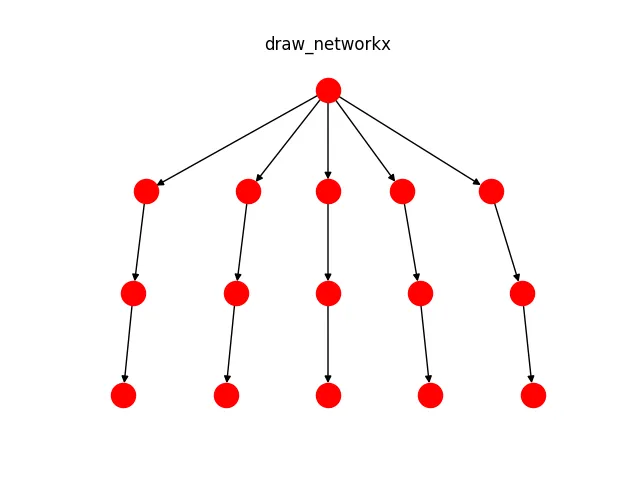
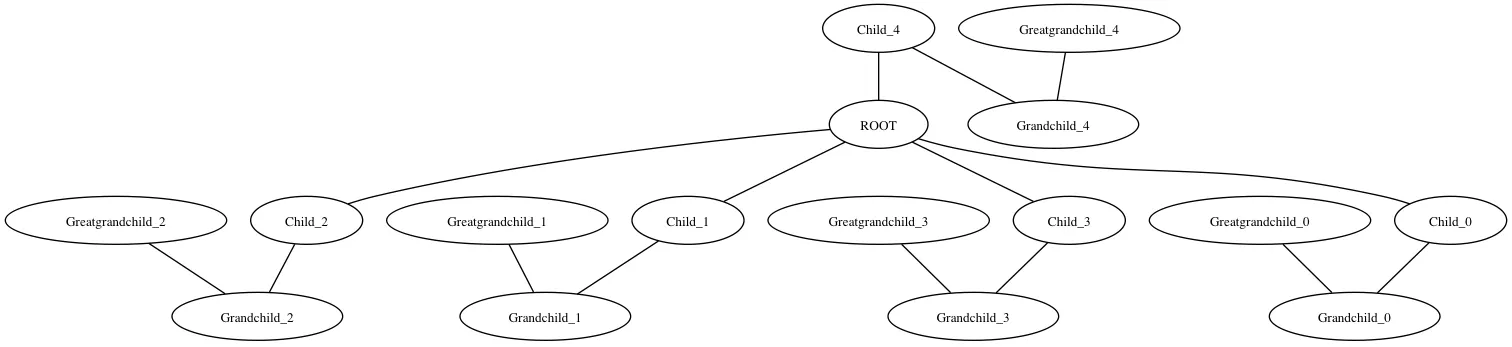
这是我用来生成上面图形的大致概述。我添加了一些标签,但除此之外就是一样的。

import networkx as nx
import matplotlib.pyplot as plt
G = nx.Graph()

G.add_node("ROOT")

for i in xrange(5):
    G.add_node("Child_%i" % i)
    G.add_node("Grandchild_%i" % i)
    G.add_node("Greatgrandchild_%i" % i)

    G.add_edge("ROOT", "Child_%i" % i)
    G.add_edge("Child_%i" % i, "Grandchild_%i" % i)
    G.add_edge("Grandchild_%i" % i, "Greatgrandchild_%i" % i)

plt.title("draw_networkx")
nx.draw_networkx(G)

plt.show()
5个回答

146

如果您使用有向图,则Graphviz dot布局将对该树形结构进行所需的操作。以下是与上述解决方案类似的一些代码,展示了如何实现该操作。

import networkx as nx
from networkx.drawing.nx_agraph import graphviz_layout
import matplotlib.pyplot as plt
G = nx.DiGraph()

G.add_node("ROOT")

for i in range(5):
    G.add_node("Child_%i" % i)
    G.add_node("Grandchild_%i" % i)
    G.add_node("Greatgrandchild_%i" % i)

    G.add_edge("ROOT", "Child_%i" % i)
    G.add_edge("Child_%i" % i, "Grandchild_%i" % i)
    G.add_edge("Grandchild_%i" % i, "Greatgrandchild_%i" % i)

# write dot file to use with graphviz
# run "dot -Tpng test.dot >test.png"
nx.nx_agraph.write_dot(G,'test.dot')

# same layout using matplotlib with no labels
plt.title('draw_networkx')
pos=graphviz_layout(G, prog='dot')
nx.draw(G, pos, with_labels=False, arrows=False)
plt.savefig('nx_test.png')

Graphviz输出

NetworkX/Matplotlib输出

更新

这是为networkx-2.0版本更新的版本(即将进入networkx-2.1,该版本也画箭头)。

import networkx as nx
from networkx.drawing.nx_agraph import write_dot, graphviz_layout
import matplotlib.pyplot as plt
G = nx.DiGraph()

G.add_node("ROOT")

for i in range(5):
    G.add_node("Child_%i" % i)
    G.add_node("Grandchild_%i" % i)
    G.add_node("Greatgrandchild_%i" % i)

    G.add_edge("ROOT", "Child_%i" % i)
    G.add_edge("Child_%i" % i, "Grandchild_%i" % i)
    G.add_edge("Grandchild_%i" % i, "Greatgrandchild_%i" % i)

# write dot file to use with graphviz
# run "dot -Tpng test.dot >test.png"
write_dot(G,'test.dot')

# same layout using matplotlib with no labels
plt.title('draw_networkx')
pos =graphviz_layout(G, prog='dot')
nx.draw(G, pos, with_labels=False, arrows=True)
plt.savefig('nx_test.png')

这里输入图片描述


1
啊哈!所以我需要的只是一个带有“点”布局的有向图。我知道这是非常小的东西。非常感谢你,Aric! - max
有没有好的方法按节点升序标记?我的意思是,我创建了一个图g = nx.full_rary_tree(2, 10),如果我打印边缘,我会得到:[(0, 1),(0, 2),(1, 3),(1, 4),(2, 5),...],但它将以不同的顺序进行可视化... - CodeKingPlusPlus
1
PyGrapviz适用于Python 3,这段代码将与Python 3一起工作。 - Aric
3
如果你在常规安装Pygraphviz时遇到任何问题,可以尝试使用 pip install --install-option="--include-path=/usr/local/include/" --install-option="--library-path=/usr/local/lib/" pygraphviz 安装。请注意,这不改变原意,只是将其翻译成了更加通俗易懂的中文。 - Rotail
2
@Rotail 在我安装了 graphviz 之后,这个方法对我有效(在我的情况下使用 brew install graphviz 安装)。 - Shivendra
显示剩余4条评论

11

你可以使用pygraphviz来实现类似的效果:

>>> import pygraphviz
>>> import networkx
>>> import networkx as nx
>>> G = nx.Graph()
>>> G.add_node("ROOT")
>>> for i in xrange(5):
...     G.add_node("Child_%i" % i)
...     G.add_node("Grandchild_%i" % i)
...     G.add_node("Greatgrandchild_%i" % i)
...     G.add_edge("ROOT", "Child_%i" % i)
...     G.add_edge("Child_%i" % i, "Grandchild_%i" % i)
...     G.add_edge("Grandchild_%i" % i, "Greatgrandchild_%i" % i)

>>> A = nx.to_agraph(G)
>>> A.layout('dot', args='-Nfontsize=10 -Nwidth=".2" -Nheight=".2" -Nmargin=0 -Gfontsize=8')
>>> A.draw('test.png')

结果: enter image description here

注意,我是从您上面发布的链接中复制了graphviz选项。我不确定为什么第四个子节点不是严格垂直排布而是在顶部绘制的。也许了解更多关于Graphviz选项的人可以帮忙。


谢谢。这正是我尝试时看到的内容。我觉得有些奇怪为什么会产生这样的结果。 - max
5
请注意,networkx的1.11版本中api已经更改。 to_agraph函数现在位于 nx.nx_agraph.to_agraph 中。 - m00am
2
有没有办法确保子元素始终在其父元素下方? - Dror
我不明白你在哪里使用了导入的 pygraphviz - Rahat Zaman

3

1

0

您可以仅使用networkx手动完成此操作。遍历树形结构,对于每个子节点,将其x坐标更改为右侧父节点.x + 1 / np.log(y_coord + 1),如果是左侧父节点,则更改为.x-1,并且y = parent.y - 1。或者使用其他算法来获取坐标,例如查看此处的图片here

import networkx as nx
import matplotlib.pyplot as plt
coord = {0: [8, 0], 2: [9, -1], 1: [8, -2], 4: [10, -2], 3: [9, -3], 5: [11, -3]}
eg = [[0, 2], [2, 1], [2, 4], [4, 3], [4, 5]]
G=nx.Graph()
G.add_edges_from(eg) 
nx.draw(G, with_labels=True, node_size=1500, node_color="skyblue", pos=coord) 
plt.show()

网页内容由stack overflow 提供, 点击上面的
可以查看英文原文,
原文链接