有没有办法调整 Yellowbrick 生成的图表字体大小?我发现文字很难读。在文档中我没有找到任何相关信息。
我使用的是 Python 3.6,Yellowbrick 0.5 在 Jupyter Notebook 中。
我使用的是 Python 3.6,Yellowbrick 0.5 在 Jupyter Notebook 中。
更新:Yellowbrick API现在使用viz.show而不是viz.poof。
Yellowbrick将matplotlib封装起来以生成可视化效果,因此您可以通过直接调用matplotlib来影响图形的所有可视设置。我发现最简单的方法是通过访问Visualizer.ax属性并在那里直接设置内容,当然,您也可以直接使用plt来管理全局图形。
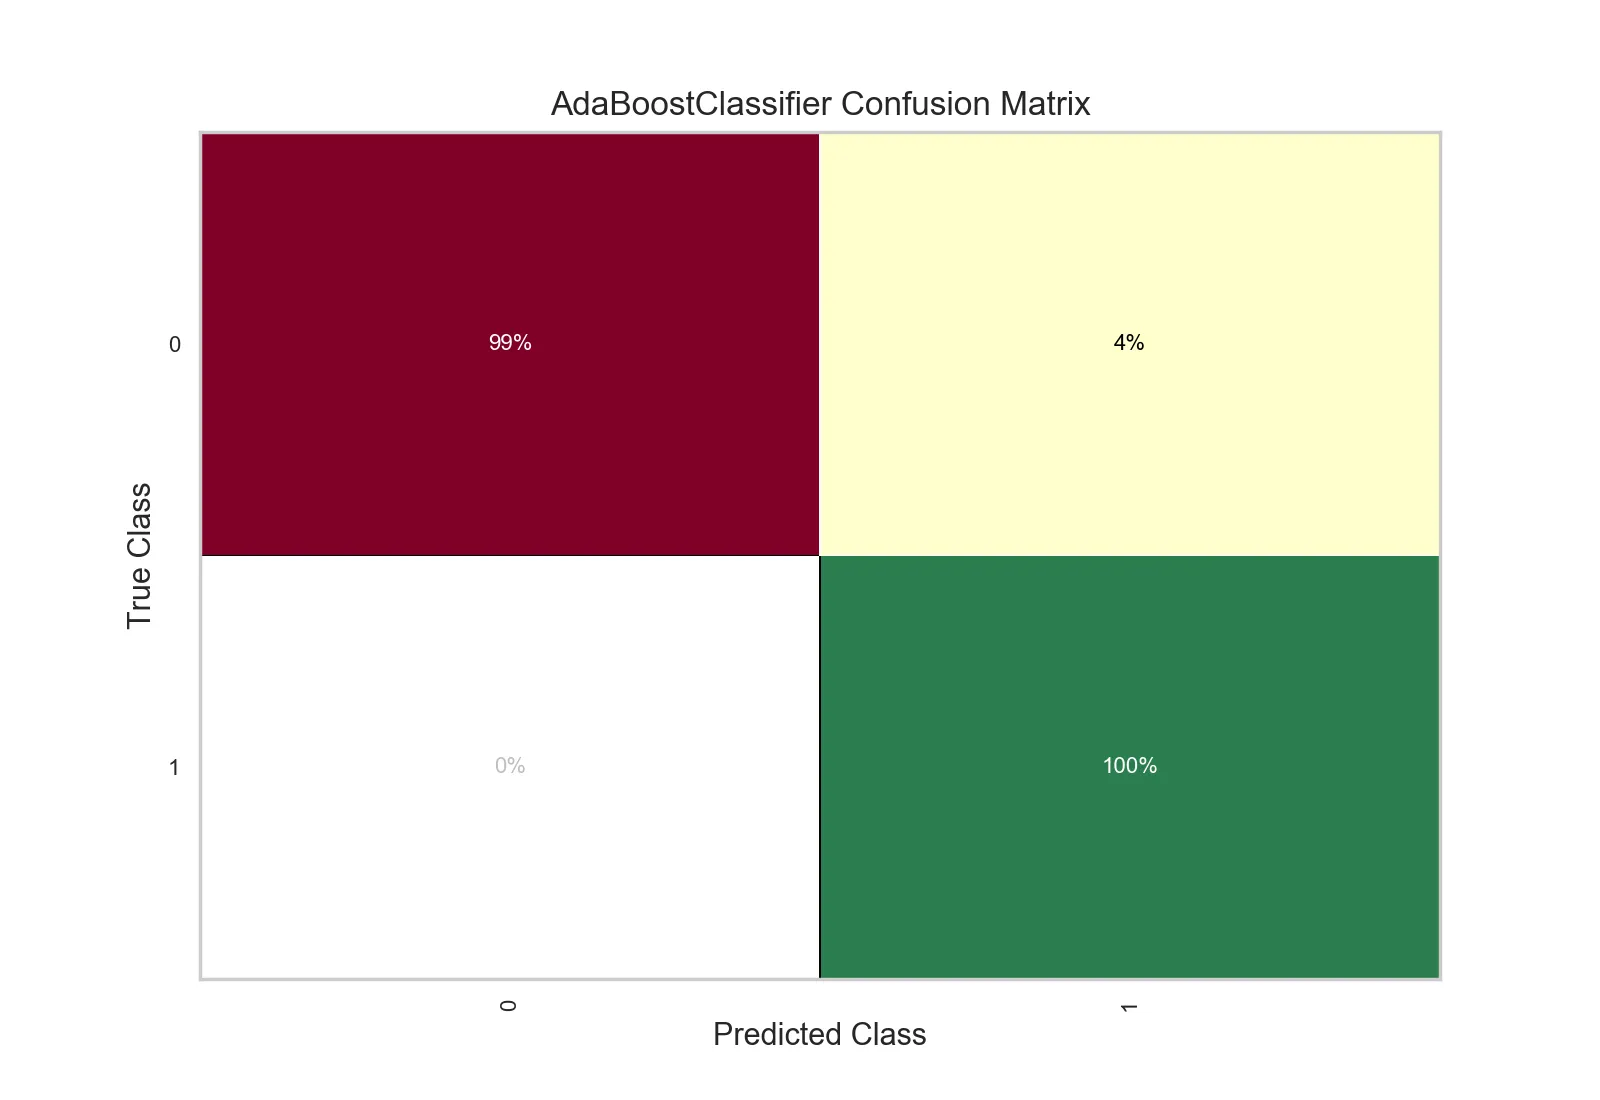
下面是一些生成类似于您示例的代码:
import pandas as pd

from yellowbrick.classifier import ConfusionMatrix
from sklearn.ensemble import AdaBoostClassifier
from sklearn.model_selection import train_test_split as tts

data = pd.read_csv('examples/data/occupancy/occupancy.csv')

features = ["temperature", "relative humidity", "light", "C02", "humidity"]

# Extract the numpy arrays from the data frame
X = data[features].as_matrix()
y = data.occupancy.as_matrix()

X_train, X_test, y_train, y_test = tts(X, y, test_size=0.2)

clf = AdaBoostClassifier()
viz = ConfusionMatrix(clf)

viz.fit(X_train, y_train)
viz.score(X_test, y_test)
viz.show()
您可以按照以下方式在score和show之间开始管理图形:
viz.fit(X_train, y_train)
viz.score(X_test, y_test)

for label in viz.ax.texts:
    label.set_size(12)

viz.show()
