如何在Matlab中使颜色条参考3D绘图中的标记而不是表面

7

我有一个如下类型的图:

enter image description here

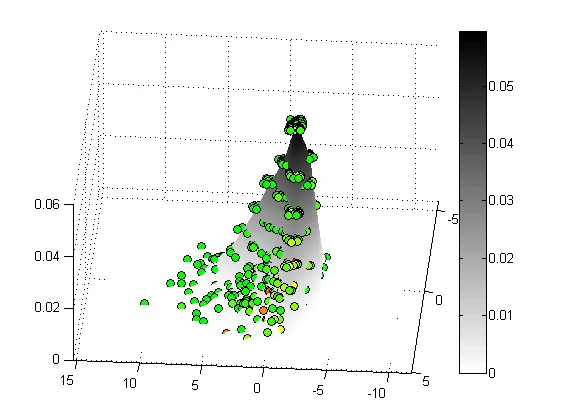
我使用surf函数创建了黑白表面,使用plot3函数绘制了标记。对于每个标记,我根据标记值定义了红-黄-绿之间的颜色映射。从图中可以看出,目前colorbar是针对表面的,但我希望它针对标记。如何实现?

谢谢!

以下是基本示例代码:

% Plot the surface with a colormap
Z = peaks;
Z = peaks./max(Z(:));
Z = (Z+1)*3/2;
surf(Z)
colormap(flipud(gray))
shading interp
hold on

% Create the 4-dimensional marker data
x = (50-10).*rand(50,1) + 10;
y = (50-10).*rand(50,1) + 10;
z = (3-1).*rand(50,1) + 1;
q = 5.*rand(50,1); % This dimension is used to select the color

% Create the color map for the markers
c1=[0 1 0]; %G
c2=[1 1 0]; %Y
c3=[1 0 0]; %R
n1 = 20;
n2 = 20;
cmap=[linspace(c1(1),c2(1),n1);linspace(c1(2),c2(2),n1);linspace(c1(3),c2(3),n1)];
cmap(:,end+1:end+n2)=[linspace(c2(1),c3(1),n2);linspace(c2(2),c3(2),n2);linspace(c2(3),c3(3),n2)];
cmap = cmap';

% Select the colors for the markers
marker_colors = zeros(size(50, 1), 3);
q_interval = max(q)-min(q);
q_int = q_interval/(n1+n2);
q_vals = zeros(n1+n2,1);
q_vals(1) = min(q);
for i = 2:size(q_vals,1)
    q_vals(i) = min(q) + (i-1)*q_int;
end
for i = 1:50
    d = abs(q_vals - q(i));
    ind = find(d == min(d));
    marker_colors(i,:) = cmap(ind,:);
    % Plot the marker
    plot3(x(i), y(i), z(i), 'o', 'color', [0 0 0], 'MarkerFaceColor', marker_colors(i,:))
end

% Lastly I plot the colorbar, which refers to the surface... :/ 
colorbar

1
在Stack Overflow中包含一个[mcve]是一个很好的实践。 - Ander Biguri
你能给坐标轴的颜色映射(这里是灰度)分配标记吗?如果可以,你可以在表面上使用纹理来模拟颜色映射... - Crowley
@jjepsuomi,你是否依赖于surfplot3函数? - Crowley
@Crowley 对我来说无所谓。只要能产生相同的结果就行 :) - jjepsuomi
1
请查看此链接:https://uk.mathworks.com/matlabcentral/answers/101346-how-do-i-use-multiple-colormaps-in-a-single-figure - Ander Biguri
显示剩余2条评论
1个回答

3

如果您不依赖于plot3函数,则可以改用scatter3

%% Data for surface
[X,Y]=meshgrid(-2:.1:2, -2:.1:2);
Z=max(0,peaks(X,Y));
C=1-cat(3,Z,Z,Z)/max(Z(:));

%% data for points
x=(rand(50,1)*4)-2;
y=(rand(50,1)*4)-2;
z=max(0,peaks(x,y));
c=0.5*rand(50,1);

%% Colormap
c1=[0 1 0]; %G
c2=[1 1 0]; %Y
c3=[1 0 0]; %R
n1 = 20;
n2 = 20;
cmap=[linspace(c1(1),c2(1),n1);linspace(c1(2),c2(2),n1);linspace(c1(3),c2(3),n1)];
cmap(:,end+1:end+n2)=[linspace(c2(1),c3(1),n2);linspace(c2(2),c3(2),n2);linspace(c2(3),c3(3),n2)];
cmap = cmap';

%% Create surface with texture defined in C
surf(X,Y,Z,C)
shading interp
hold on

%% plot points in coordinates x,y,z with markers with 12 pt in diameter,
%% coloured according to c values, filled and with black marker edges.
scatter3(x,y,z,12,c,'filled','markerEdgeColor','k')

%% set colormap (change will apply only for scatter because surf uses texxture map)
colormap(cmap)
colorbar

谢谢@Crowley :) 变量´c´的目的是什么?我在定义后没有看到它被使用。 - jjepsuomi
明白了 =) 我会用我的数据尝试一下这段代码 :) 非常感谢! =) - jjepsuomi
很抱歉,点的颜色与随机值无关,而是与高度绑定。我已经编辑了代码,使其匹配颜色的随机性并使用变量 c - Crowley
没问题 =) 谢谢 - jjepsuomi
太棒了!像魔法一样运行 :) - jjepsuomi

网页内容由stack overflow 提供, 点击上面的
可以查看英文原文,
原文链接