按另一列的值对一列进行着色

6

我想创建一个gt表格,在单个单元格中显示两列的数字值,但根据其中一列的值对单元格进行着色。

例如,使用ToothGrowth示例数据,我想将lendose列放在一个单元格中,但根据dose的值对单元格背景进行着色。

我尝试手动创建颜色向量来着色len_dose列,但这不起作用,因为它似乎将颜色向量重新应用于每个不同级别的len_dose,而不是dose。我猜你可以使用tab_style()手动格式化单元格,但这似乎效率低下,并且不能提供文本颜色更改以最大化与背景的对比度的好功能。我不知道有什么有效的方法可以做到这一点。

我尝试过:

library(gt)
library(dplyr)
library(scales)
library(glue)

# Manually map dose to color
dose_colors <- col_numeric(palette = 'Reds', domain = range(ToothGrowth$dose))(ToothGrowth$dose)

ToothGrowth %>%
  mutate(len_dose = glue('{len}: ({dose})')) %>%
  gt(rowname_col = 'supp') %>%
  cols_hide(c(len, dose)) %>%
  data_color(len_dose, colors = dose_colors)  

输出(不好,因为剂量没有被着色):

enter image description here


1
这个现在已经在gt中实现了 - 请参见https://github.com/rstudio/gt/issues/1103 - 所以最好的解决方案就是使用他们的新data_color()函数。 - Lukas Wallrich
2个回答

5

2023年2月更新

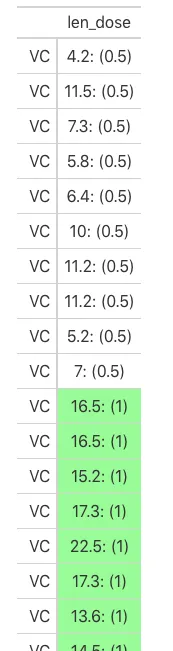
gt包现已添加了基于其他列进行着色的选项- data_color()现已获得taregt_columns参数。因此,这变得更加简单:

library(gt)
library(dplyr)

ToothGrowth %>%
  mutate(len_dose = glue('{len}: ({dose})')) %>%
  gt(rowname_col = 'supp') %>%
  cols_hide(c(len, dose)) %>%
  data_color(columns = "dose", target_columns = "len_dose",
             palette = "ggsci::green_material")

已过时

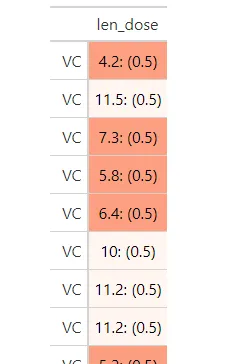
我遇到了同样的问题,并调整了 gt::data_color 函数以接受单独的源和目标列 - 这样,下面的代码应该可以生成您所需的输出。

# Distinguish SOURCE_columns and TARGET_columns

my_data_color <- function (data, SOURCE_columns, TARGET_columns, colors, alpha = NULL, apply_to = c("fill", 
                                                                                                    "text"), autocolor_text = TRUE) 
{
  stop_if_not_gt(data = data)
  apply_to <- match.arg(apply_to)
  colors <- rlang::enquo(colors)
  data_tbl <- dt_data_get(data = data)
  colors <- rlang::eval_tidy(colors, data_tbl)
  resolved_source_columns <- resolve_cols_c(expr = {
    {
      SOURCE_columns
    }
  }, data = data)
  resolved_target_columns <- resolve_cols_c(expr = {
    {
      TARGET_columns
    }
  }, data = data)
  rows <- seq_len(nrow(data_tbl))
  data_color_styles_tbl <- dplyr::tibble(locname = character(0), 
                                         grpname = character(0), colname = character(0), locnum = numeric(0), 
                                         rownum = integer(0), colnum = integer(0), styles = list())
  for (i in seq_along(resolved_source_columns)) {
    data_vals <- data_tbl[[resolved_source_columns[i]]][rows]
    if (inherits(colors, "character")) {
      if (is.numeric(data_vals)) {
        color_fn <- scales::col_numeric(palette = colors, 
                                        domain = data_vals, alpha = TRUE)
      }
      else if (is.character(data_vals) || is.factor(data_vals)) {
        if (length(colors) > 1) {
          nlvl <- if (is.factor(data_vals)) {
            nlevels(data_vals)
          }
          else {
            nlevels(factor(data_vals))
          }
          if (length(colors) > nlvl) {
            colors <- colors[seq_len(nlvl)]
          }
        }
        color_fn <- scales::col_factor(palette = colors, 
                                       domain = data_vals, alpha = TRUE)
      }
      else {
        cli::cli_abort("Don't know how to map colors to a column of class {class(data_vals)[1]}.")
      }
    }
    else if (inherits(colors, "function")) {
      color_fn <- colors
    }
    else {
      cli::cli_abort("The `colors` arg must be either a character vector of colors or a function.")
    }
    color_fn <- rlang::eval_tidy(color_fn, data_tbl)
    color_vals <- color_fn(data_vals)
    color_vals <- html_color(colors = color_vals, alpha = alpha)
    color_styles <- switch(apply_to, fill = lapply(color_vals, 
                                                   FUN = function(x) cell_fill(color = x)), text = lapply(color_vals, 
                                                                                                          FUN = function(x) cell_text(color = x)))
    data_color_styles_tbl <- dplyr::bind_rows(data_color_styles_tbl, 
                                              generate_data_color_styles_tbl(column = resolved_target_columns[i], rows = rows, 
                                                                             color_styles = color_styles))
    if (apply_to == "fill" && autocolor_text) {
      color_vals <- ideal_fgnd_color(bgnd_color = color_vals)
      color_styles <- lapply(color_vals, FUN = function(x) cell_text(color = x))
      data_color_styles_tbl <- dplyr::bind_rows(data_color_styles_tbl, 
                                                generate_data_color_styles_tbl(column = resolved_target_columns[i], 
                                                                               rows = rows, color_styles = color_styles))
    }
  }
  dt_styles_set(data = data, styles = dplyr::bind_rows(dt_styles_get(data = data), 
                                                       data_color_styles_tbl))
}


# Add function into gt namespace (so that internal gt functions can be called)
library(gt)
tmpfun <- get("data_color", envir = asNamespace("gt"))
environment(my_data_color) <- environment(tmpfun)

library(dplyr)
#> 
#> Attaching package: 'dplyr'
#> The following objects are masked from 'package:stats':
#> 
#>     filter, lag
#> The following objects are masked from 'package:base':
#> 
#>     intersect, setdiff, setequal, union
library(glue)

# Map dose to color
ToothGrowth %>%
  mutate(len_dose = glue('{len}: ({dose})')) %>%
  gt(rowname_col = 'supp') %>%
  cols_hide(c(len, dose)) %>%
  my_data_color(SOURCE_columns = "dose", TARGET_columns = "len_dose", 
             colors = scales::col_numeric(palette = c("red", "green"), domain = c(min(ToothGrowth$dose), max(ToothGrowth$dose))))  

使用 reprex v2.0.2 工具于 2022-11-03 创建


1
这很棒,你应该考虑向gt提交一个pull request。 - qdread
谢谢!我向gt建议过这个,但我认为它与他们的界面不太一致... - Lukas Wallrich
1
这个现在已经在gt中实现了 - 请参见https://github.com/rstudio/gt/issues/1103 - 所以最好的解决方案就是使用他们的新data_color()函数。 - Lukas Wallrich
1
谢谢您让我和大家知道!您是否考虑更新这个被接受的答案以反映gt的data_color()的新版本? - qdread

4

不确定您是否已经找到了解决方法,但以下是我所做的:

  • If you use tab_style() you don't need to try and create the vector of colors and can instead set the background color you want based on the dose column. If you want to color values differently based on dose, in addition to what I've colored here, then create another tab_style() for the desired value.

    library(gt)
     library(dplyr)
     library(scales)
     library(glue)
    
     ToothGrowth %>%
       mutate(len_dose = glue('{len}: ({dose})')) %>%
       gt(rowname_col = 'supp') %>%
       tab_style(
         style = cell_fill(color = "palegreen"),
         location = cells_body(
           columns = len_dose,
           rows = dose >= 1.0
         )
       ) %>%
       cols_hide(c(len, dose))
    

enter image description here


这看起来很不错!唯一令人失望的是,如果您想要有两个以上不同的背景值,则仍然需要多次调用tab_style。使用此解决方案,仍然无法像data_color一样使用连续值,对吗? - qdread
你可以像这样使用 &|ToothGrowth %>% mutate(len_dose = glue('{len}: ({dose})')) %>% gt(rowname_col = 'supp') %>% tab_style( style = cell_fill(color = "palegreen"), location = cells_body( columns = len_dose, rows = dose > 1.0 | dose < 1.0 ) ) %>% cols_hide(c(len, dose)) - user3585829
但是这仍然需要针对每个要添加的背景颜色进行不同的tab_style调用,是吗?正如我在原始问题中所述,如果您有一个连续值列要使用其颜色来着色另一列,那么逐个使用tab_style添加颜色并不是非常有效。因此,我现在暂时不接受您的答案,再次感谢您的帮助。 - qdread

网页内容由stack overflow 提供, 点击上面的
可以查看英文原文,
原文链接