如何限制ggplot2中的调色板?

3

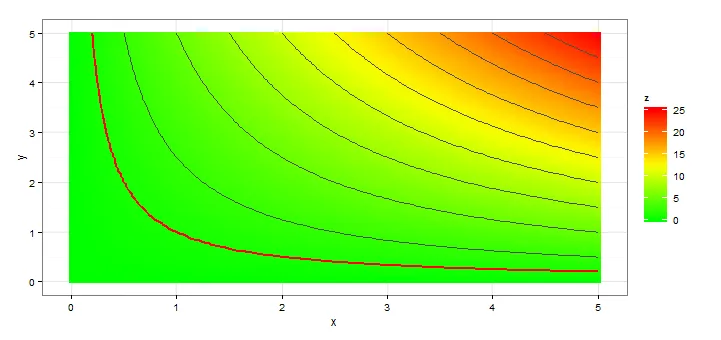
从下图中,我希望将从绿色到红色(黄色部分)的过渡限制在红线上。当z<1时,我想用绿色表示,当z>1时用红色表示,并让黄色位于z=1的中心。

library(ggplot2)

Data(仅用于说明情节)

x=seq(0,5,length=1e2)
y=seq(0,5,length=1e2)
#
df=expand.grid(x=x,y=y)
df$z=df$x*df$y

情节

ggplot(data=df, aes(x=x,y=y,z=z,fill=z)) +
geom_raster()+  
stat_contour(breaks=1, size=1, colour="red") +
scale_fill_gradientn (colours=colorRampPalette (c ("green", "yellow","red")) (20))

从代码中获得的图形

感谢您的帮助


1
scale_fill_gradient2() 可能会有所帮助 - https://dev59.com/mnzaa4cB1Zd3GeqPMiwY#21595743 - CMichael
1个回答

2

以下是一种创建图表的方法。正如@CMichael所指出的那样,可以使用函数scale_fill_gradient2来实现。它允许基于三种颜色指定连续的颜色比例尺。

ggplot(data=df, aes(x = x, y = y, z = z, fill = z)) +
  geom_raster() +  
  stat_contour(breaks = 1, size = 1, colour = "red") +
  scale_fill_gradient2(low = "green", mid = "yellow", high = "red", midpoint = 1)

谢谢。我用对数变换的最终代码是:ggplot(data=df, aes(x = xD, y = yD, z = zD, fill = zD)) + geom_raster() + stat_contour(breaks = 1, size = 1, colour = "red") + scale_fill_gradient2(low = "green", midpoint = log(1), mid = "yellow", high = "red",trans = "log") - Leon-Alph

网页内容由stack overflow 提供, 点击上面的
可以查看英文原文,
原文链接