操作xtable()输出

3

我正在尝试使用xtable()打印出 这个 表格,它如下所示:

                   X            B.1            B.2            B.3
1        (Intercept) -1.669 (0.093) -1.701 (0.094) -1.774 (0.121)
2          SEXFemale  -0.46 (0.023)  -0.386 (0.04)  -0.274 (0.17)
3    SEXFemale:BLACK                                0.132 (0.163)
4    SEXFemale:ASIAN                               -0.063 (0.089)
5 SEXFemale:HISPANIC                               -0.128 (0.074)

但我希望覆盖打印第一列的方式。是否可能在xtable()或其他函数中包含LaTeX命令来完成这个任务?具体而言,我希望第一列为:

    X
Male: Female
Female X Black
       X Asian
       X Hispanic

我想在列中写入一个\phantom{}开关,以使间距正确。

你应该在http://tex.stackexchange.com/上提问。 - Giel
这可以通过 print.xtable(..., print.results = FALSE) 实现,然后使用正则表达式查找第二列并插入 \phantom{} 调用来完成。我现在得走了,但是我以后可能会发布一个解决方案。 - Roman Luštrik
罗曼,感激不尽。提前致谢。 - user702432
也许你可以将X列分成两列,使用ftable生成表格,并使用memisc::toLatex创建它的Latex输出? - ROLO
2个回答

2

在调用xtable()之前,您可以使用正则表达式将\phantom{}插入到表格中之前

重新创建您的数据:

x <- structure(list(X = structure(c(1L, 2L, 4L, 3L, 5L), .Label = c("(Intercept)", 
                                                                    "SEXFemale", "SEXFemale:ASIAN", "SEXFemale:BLACK", "SEXFemale:HISPANIC"
), class = "factor"), B.1 = structure(c(3L, 2L, 1L, 1L, 1L), .Label = c("", 
                                                                        "-0.46 (0.023)", "-1.669 (0.093)"), class = "factor"), B.2 = structure(c(3L, 
                                                                                                                                                 2L, 1L, 1L, 1L), .Label = c("", "-0.386 (0.04)", "-1.701 (0.094)"
                                                                                                                                                 ), class = "factor"), B.3 = structure(c(4L, 3L, 5L, 1L, 2L), .Label = c("-0.063 (0.089)", 
                                                                                                                                                                                                                         "-0.128 (0.074)", "-0.274 (0.17)", "-1.774 (0.121)", "0.132 (0.163)"
                                                                                                                                                 ), class = "factor")), .Names = c("X", "B.1", "B.2", "B.3"), class = "data.frame", row.names = c(NA, 
                                                                                                                                                                                                                                                  -5L))

正则表达式:

x$X <- gsub("SEXFemale:", "\\\\phantom{Female} X ", x$X)
x$X <- gsub("SEXFemale", "Female", x$X)


library(xtable)
xx <- print(xtable(x), print.results = FALSE, include.rownames = FALSE,
        sanitize.text.function=function(x)x)
cat(xx)

生成的文本:
% latex table generated in R 2.15.0 by xtable 1.7-0 package
% Thu Jul 26 17:10:05 2012
\begin{table}[ht]
\begin{center}
\begin{tabular}{llll}
  \hline
X & B.1 & B.2 & B.3 \\ 
  \hline
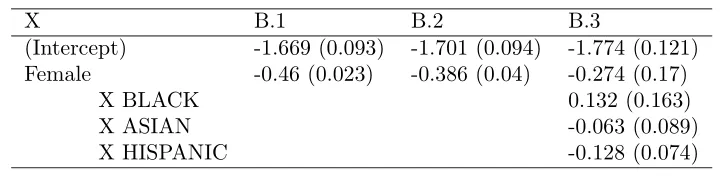
(Intercept) & -1.669 (0.093) & -1.701 (0.094) & -1.774 (0.121) \\ 
  Female & -0.46 (0.023) & -0.386 (0.04) & -0.274 (0.17) \\ 
  \phantom{Female} X BLACK &  &  & 0.132 (0.163) \\ 
  \phantom{Female} X ASIAN &  &  & -0.063 (0.089) \\ 
  \phantom{Female} X HISPANIC &  &  & -0.128 (0.074) \\ 
   \hline
\end{tabular}
\end{center}
\end{table}

最终输出结果如下:

enter image description here


0

好的,这是一种实现方法。

# dummy example to get ANOVA table
ctl <- c(4.17,5.58,5.18,6.11,4.50,4.61,5.17,4.53,5.33,5.14)
trt <- c(4.81,4.17,4.41,3.59,5.87,3.83,6.03,4.89,4.32,4.69)
group <- gl(2,10,20, labels=c("Ctl","Trt"))
weight <- c(ctl, trt)
lm.D9 <- lm(weight ~ group)

# print xtable into a character
x <- print(xtable(lm.D9), print.results = FALSE)

我在这里做的是找到特定的单词并将它们包裹在\emph{}中。你可以用特定的文本替换它,或者在你自己的开关中包裹它。

x <- sub("(\\(Intercept\\))", "\\\\emph{\\1}", x)
x <- sub("(groupTrt)", "\\\\emph{\\1}", x)
cat(x)

% latex table generated in R 2.15.1 by xtable 1.7-0 package
% Thu Jul 26 17:41:16 2012
\begin{table}[ht]
\begin{center}
\begin{tabular}{rrrrr}
  \hline
 & Estimate & Std. Error & t value & Pr($>$$|$t$|$) \\ 
  \hline
\emph{(Intercept)} & 5.0320 & 0.2202 & 22.85 & 0.0000 \\ 
  \emph{groupTrt} & -0.3710 & 0.3114 & -1.19 & 0.2490 \\ 
   \hline
\end{tabular}
\end{center}
\end{table}

enter image description here


网页内容由stack overflow 提供, 点击上面的
可以查看英文原文,
原文链接