使用鸢尾花数据集,我们可以创建一个简单的分面图表:
import altair as alt
from vega_datasets import data
iris = data.iris.url

alt.Chart(iris, title='Main Title').mark_bar().encode(
    x='petalWidth:Q',
    y='count(petalLength):Q',
    color='species:N',
    facet=alt.Facet('species:N', title=None)
)
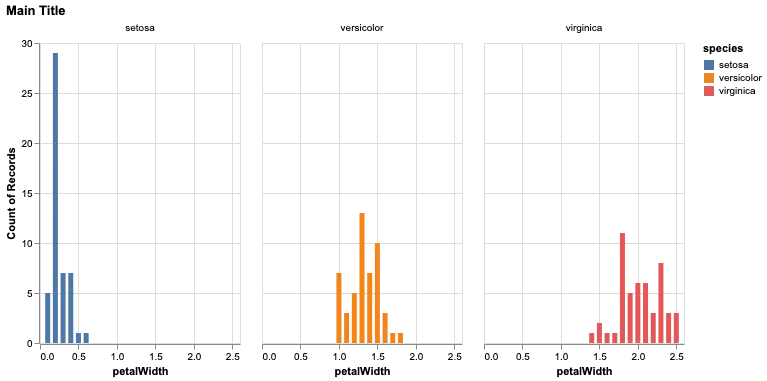
我可以控制主图标题和分面标题。
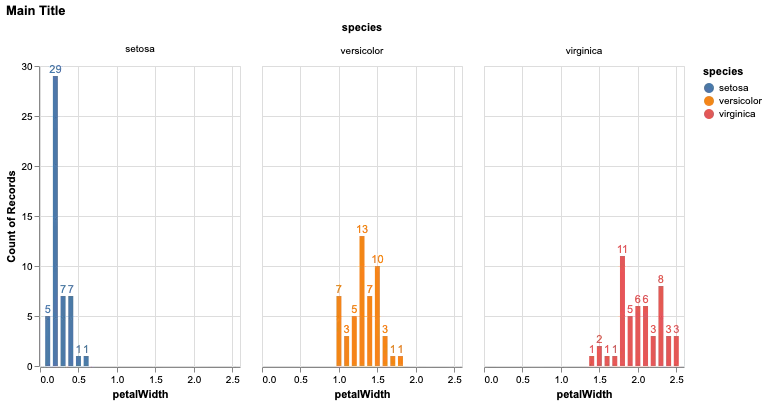
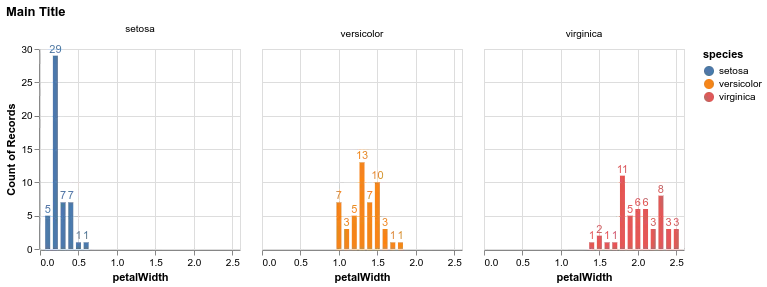
现在假设我想创建相同的图表,但要向每个条形图添加文本注释:
base = alt.Chart(iris).encode(
    x='petalWidth:Q',
    y='count(petalLength):Q',
    color='species:N',
    text='count(petalLength):Q'
)

c = base.mark_bar()
t = base.mark_text(dy=-6)

alt.layer(c, t).facet('species:N', title=None).properties(title='Main Title')