如何使用data.table进行因子变量的独热编码?

11

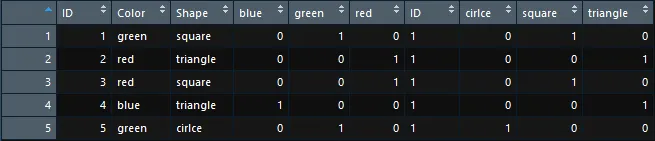
对于那些不熟悉的人来说,独热编码只是将类别列(即因子)转换为多个二进制指示变量列的过程,其中每个新列对应原始列的一个类别。以下示例将更好地说明:

dt <- data.table(
  ID=1:5, 
  Color=factor(c("green", "red", "red", "blue", "green"), levels=c("blue", "green", "red", "purple")),
  Shape=factor(c("square", "triangle", "square", "triangle", "cirlce"))
)

dt
   ID Color    Shape
1:  1 green   square
2:  2   red triangle
3:  3   red   square
4:  4  blue triangle
5:  5 green   cirlce

# one hot encode the colors
color.binarized <- dcast(dt[, list(V1=1, ID, Color)], ID ~ Color, fun=sum, value.var="V1", drop=c(TRUE, FALSE))

# Prepend Color_ in front of each one-hot-encoded feature
setnames(color.binarized, setdiff(colnames(color.binarized), "ID"), paste0("Color_", setdiff(colnames(color.binarized), "ID")))

# one hot encode the shapes
shape.binarized <- dcast(dt[, list(V1=1, ID, Shape)], ID ~ Shape, fun=sum, value.var="V1", drop=c(TRUE, FALSE))

# Prepend Shape_ in front of each one-hot-encoded feature
setnames(shape.binarized, setdiff(colnames(shape.binarized), "ID"), paste0("Shape_", setdiff(colnames(shape.binarized), "ID")))

# Join one-hot tables with original dataset
dt <- dt[color.binarized, on="ID"]
dt <- dt[shape.binarized, on="ID"]

dt
   ID Color    Shape Color_blue Color_green Color_red Color_purple Shape_cirlce Shape_square Shape_triangle
1:  1 green   square          0           1         0            0            0            1              0
2:  2   red triangle          0           0         1            0            0            0              1
3:  3   red   square          0           0         1            0            0            1              0
4:  4  blue triangle          1           0         0            0            0            0              1
5:  5 green   cirlce          0           1         0            0            1            0              0

这是我经常做的事情,但是你可以看到它非常繁琐(特别是当我的数据有许多因子列时)。 有没有更简单的方法使用data.table完成? 特别是,当我尝试像这样进行一些操作时,我认为dcast将允许我同时对多个列进行独热编码:

这是我经常做的事情,但是你可以看到它非常繁琐(特别是当我的数据有许多因子列时)。 是否有更简便的方式使用data.table完成此操作? 特别是,我假设dcast可以一次性对多个列进行独热编码:

dcast(dt[, list(V1=1, ID, Color, Shape)], ID ~ Color + Shape, fun=sum, value.var="V1", drop=c(TRUE, FALSE))

我获取列组合

   ID blue_cirlce blue_square blue_triangle green_cirlce green_square green_triangle red_cirlce red_square red_triangle purple_cirlce purple_square purple_triangle
1:  1           0           0             0            0            1              0          0          0            0             0             0               0
2:  2           0           0             0            0            0              0          0          0            1             0             0               0
3:  3           0           0             0            0            0              0          0          1            0             0             0               0
4:  4           0           0             1            0            0              0          0          0            0             0             0               0
5:  5           0           0             0            1            0              0          0          0            0             0             0               0

对于 OHE,最好使用稀疏矩阵进行处理。 - David Arenburg
@DavidArenburg 感谢您的快速回复。在生产模型中,我通常会这样做,但是当我在尝试新想法并在小数据集上进行测试时,我喜欢使用data.table,因为它更容易查看/绘图/子集化。 - Ben
1
好的,那我就直接执行 dcast(melt(dt, 1), ID ~ value, length)。这个问题可能已经有人解决过了。 - David Arenburg
1
?model.matrix - Hong Ooi
5个回答

10

Here you go:

dcast(melt(dt, id.vars='ID'), ID ~ variable + value, fun = length)
#   ID Color_blue Color_green Color_red Shape_cirlce Shape_square Shape_triangle
#1:  1          0           1         0            0            1              0
#2:  2          0           0         1            0            0              1
#3:  3          0           0         1            0            1              0
#4:  4          1           0         0            0            0              1
#5:  5          0           1         0            1            0              0

为了获取缺失的因素,您可以执行以下操作:
res = dcast(melt(dt, id = 'ID', value.factor = T), ID ~ value, drop = F, fun = length)
setnames(res, c("ID", unlist(lapply(2:ncol(dt),
                             function(i) paste(names(dt)[i], levels(dt[[i]]), sep = "_")))))
res
#   ID Color_blue Color_green Color_red Color_purple Shape_cirlce Shape_square Shape_triangle
#1:  1          0           1         0            0            0            1              0
#2:  2          0           0         1            0            0            0              1
#3:  3          0           0         1            0            0            1              0
#4:  4          1           0         0            0            0            0              1
#5:  5          0           1         0            0            1            0              0

啊,这看起来非常优雅,但不幸的是它缺少Color_purple(一个未使用的颜色级别)。 - Ben
看起来我有点过早了。不幸的是,这仅在每个因子列的级别完全不同的情况下才有效。但我很确定我可以修复它。你帮了我90%的忙。 - Ben
@Ben 或许可以先从这个开始,这样你就不需要后来重命名了:newdt = setDT(lapply(1:ncol(dt), function(i) if (is.factor(dt[[i]])) { factor(paste(names(dt)[i], levels(dt[[i]]), sep = "_"))[dt[[i]]] } else { dt[[i]] })) - eddi

8
使用 model.matrix 函数:
> cbind(dt[, .(ID)], model.matrix(~ Color + Shape, dt))
   ID (Intercept) Colorgreen Colorred Colorpurple Shapesquare Shapetriangle
1:  1           1          1        0           0           1             0
2:  2           1          0        1           0           0             1
3:  3           1          0        1           0           1             0
4:  4           1          0        0           0           0             1
5:  5           1          1        0           0           0             0

如果你在进行建模,这样做是最有意义的。

如果你想要抑制截距(并恢复第一个变量的别名列):

> cbind(dt[, .(ID)], model.matrix(~ Color + Shape - 1, dt))
   ID Colorblue Colorgreen Colorred Colorpurple Shapesquare Shapetriangle
1:  1         0          1        0           0           1             0
2:  2         0          0        1           0           0             1
3:  3         0          0        1           0           1             0
4:  4         1          0        0           0           0             1
5:  5         0          1        0           0           0             0

Matrix::sparse.model.matrix 会更好。 - Dmitriy Selivanov
1
"Shapecircle" 消失了...? - eddi
2
@eddi 可以从 ShapesquareShapetriangle 的值推断出 Shapecircle。一般而言,表示 n 层需要 n-1 列。 - Hong Ooi
1
@HongOoi 虽然这是正确的,但是一位热编码经常用于机器学习模型,这些模型随机抽样列的子集(例如随机森林,梯度提升等)。对于这些模型,通常最好包括所有数据列,因为在列子集被取出后,无法推断缺少的一列。 - Ben
@Ben,我不确定我理解你关于使用n列而不是n-1的评论。 - learningAsIGo
当我在模型矩阵公式中一次包含多个变量时,似乎只有缺失级别的问题。 - gannawag

5
这里是一个更加通用化的版本,基于eddi的方案:
one_hot <- function(dt, cols="auto", dropCols=TRUE, dropUnusedLevels=FALSE){
  # One-Hot-Encode unordered factors in a data.table
  # If cols = "auto", each unordered factor column in dt will be encoded. (Or specifcy a vector of column names to encode)
  # If dropCols=TRUE, the original factor columns are dropped
  # If dropUnusedLevels = TRUE, unused factor levels are dropped

  # Automatically get the unordered factor columns
  if(cols[1] == "auto") cols <- colnames(dt)[which(sapply(dt, function(x) is.factor(x) & !is.ordered(x)))]

  # Build tempDT containing and ID column and 'cols' columns
  tempDT <- dt[, cols, with=FALSE]
  tempDT[, ID := .I]
  setcolorder(tempDT, unique(c("ID", colnames(tempDT))))
  for(col in cols) set(tempDT, j=col, value=factor(paste(col, tempDT[[col]], sep="_"), levels=paste(col, levels(tempDT[[col]]), sep="_")))

  # One-hot-encode
  if(dropUnusedLevels == TRUE){
    newCols <- dcast(melt(tempDT, id = 'ID', value.factor = T), ID ~ value, drop = T, fun = length)
  } else{
    newCols <- dcast(melt(tempDT, id = 'ID', value.factor = T), ID ~ value, drop = F, fun = length)
  }

  # Combine binarized columns with the original dataset
  result <- cbind(dt, newCols[, !"ID"])

  # If dropCols = TRUE, remove the original factor columns
  if(dropCols == TRUE){
    result <- result[, !cols, with=FALSE]
  }

  return(result)
}

请注意,对于大型数据集,最好使用Matrix::sparse.model.matrix

更新(2017)

现在已经整合到mltools包中。


1
你的函数对我来说非常好用,但是由于它将n个因子水平转换为n列,所以对于创建对多重共线性敏感的模型并不实用。是否有一个调整过的版本的函数,可以每个因子列生成n-1个虚拟列? - constiii
@Constantin 不行,但你可以在编码后删除其中一列。 - Ben

1
如果没有人提供每次手动编写此代码的简洁方法,您可以随时创建一个函数/宏:
OHE <- function(dt, grp, encodeCols) {
        grpSymb = as.symbol(grp)
        for (col in encodeCols) {
                colSymb = as.symbol(col)
                eval(bquote(
                            dt[, .SD
                               ][, V1 := 1
                               ][, dcast(.SD, .(grpSymb) ~ .(colSymb), fun=sum, value.var='V1')
                               ][, setnames(.SD, setdiff(colnames(.SD), grp), sprintf("%s_%s", col, setdiff(colnames(.SD), grp)))
                               ][, dt <<- dt[.SD, on=grp]
                               ]
                            ))
        }
        dt
}

dtOHE = OHE(dt, 'ID', c('Color', 'Shape'))
dtOHE

   ID Color    Shape Color_blue Color_green Color_red Shape_cirlce Shape_square Shape_triangle
1:  1 green   square          0           1         0            0            1              0
2:  2   red triangle          0           0         1            0            0              1
3:  3   red   square          0           0         1            0            1              0
4:  4  blue triangle          1           0         0            0            0              1
5:  5 green   cirlce          0           1         0            1            0              0

0
用几行代码可以解决这个问题:
library(tidyverse)
dt2 <- spread(dt,Color,Shape)
dt3 <- spread(dt,Shape,Color)

df <- cbind(dt2,dt3)

df2 <- apply(df, 2, function(x){sapply(x, function(y){
  ifelse(is.na(y),0,1)
})})

df2 <- as.data.frame(df2)

df <- cbind(dt,df2[,-1])

table image


网页内容由stack overflow 提供, 点击上面的
可以查看英文原文,
原文链接