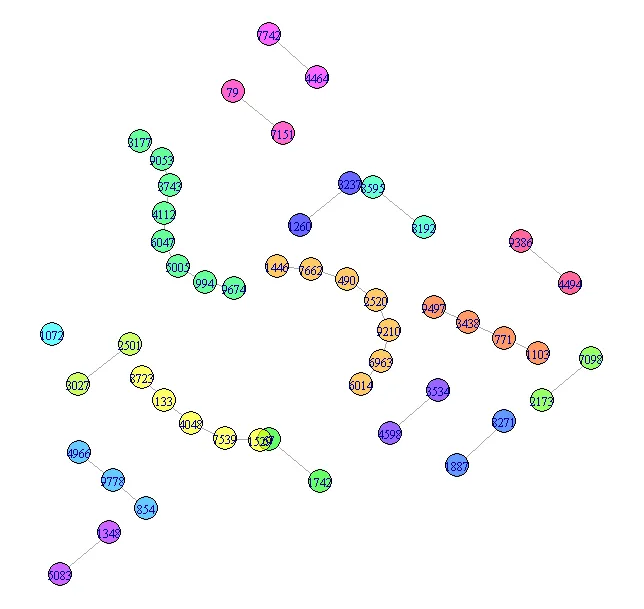
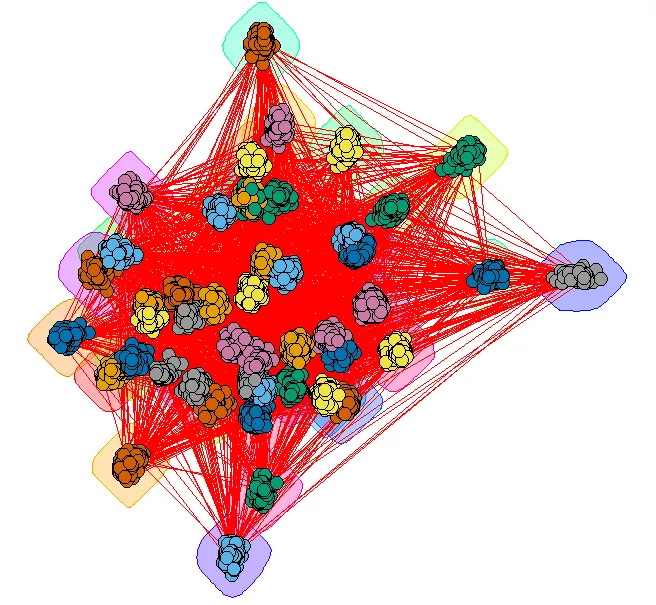
我用R模拟了一些图形网络数据(约10,000个观测值),并尝试使用R中的visNetwork库对其进行可视化。但是,数据非常杂乱,很难在视觉上进行分析(我知道在现实生活中,网络数据是使用图形查询语言进行分析的)。
目前有没有什么方法可以改善我创建的图形网络可视化(以便我可以探索一些彼此堆叠在一起的链接和节点)?
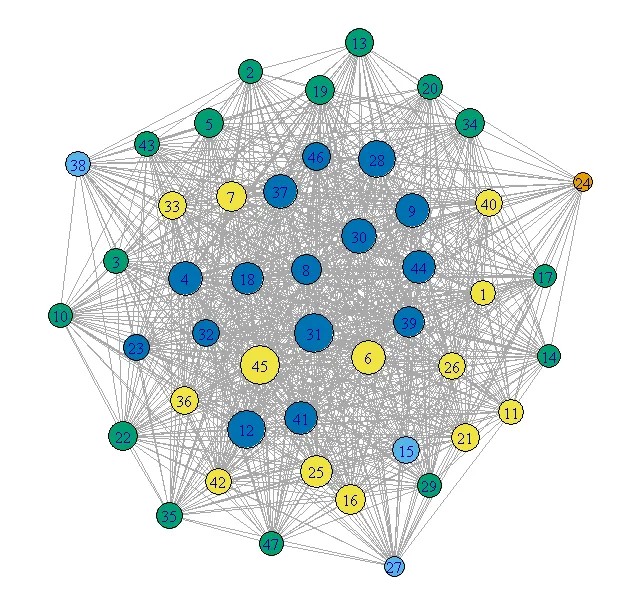
是否可以使用“networkD3”和“diagrammeR”等库来更好地可视化这个网络?
我已经附上了可重现的代码如下:
目前有没有什么方法可以改善我创建的图形网络可视化(以便我可以探索一些彼此堆叠在一起的链接和节点)?
是否可以使用“networkD3”和“diagrammeR”等库来更好地可视化这个网络?
我已经附上了可重现的代码如下:
library(igraph)
library(dplyr)
library(visNetwork)

#create file from which to sample from
x5 <- sample(1:10000, 10000, replace=T)
#convert to data frame
x5 = as.data.frame(x5)

#create first file (take a random sample from the created file)
a = sample_n(x5, 9000)
#create second file (take a random sample from the created file)
b = sample_n(x5, 9000)

#combine
c = cbind(a,b)
#create dataframe
c = data.frame(c)
#rename column names
colnames(c) <- c("a","b")

graph <- graph.data.frame(c, directed=F)
graph <- simplify(graph)
graph

plot(graph)

library(visNetwork)
nodes <- data.frame(id = V(graph)$name, title = V(graph)$name)
nodes <- nodes[order(nodes$id, decreasing = F),]
edges <- get.data.frame(graph, what="edges")[1:2]

visNetwork(nodes, edges) %>%   visIgraphLayout(layout = "layout_with_fr") %>%
    visOptions(highlightNearest = TRUE, nodesIdSelection = TRUE) %>%
    visInteraction(navigationButtons = TRUE)
谢谢