这个问题困扰了我一段时间。我正在尝试处理大量数据,这些数据以.fits文件的形式存在(大约为11000x9000像素)。我需要做的是在天空上创建一个“缩放”的RA / Dec坐标图(最好使用astropy.wcs),其中包含来自一个fits文件的等高线和另一个文件的灰度(或热力图)。
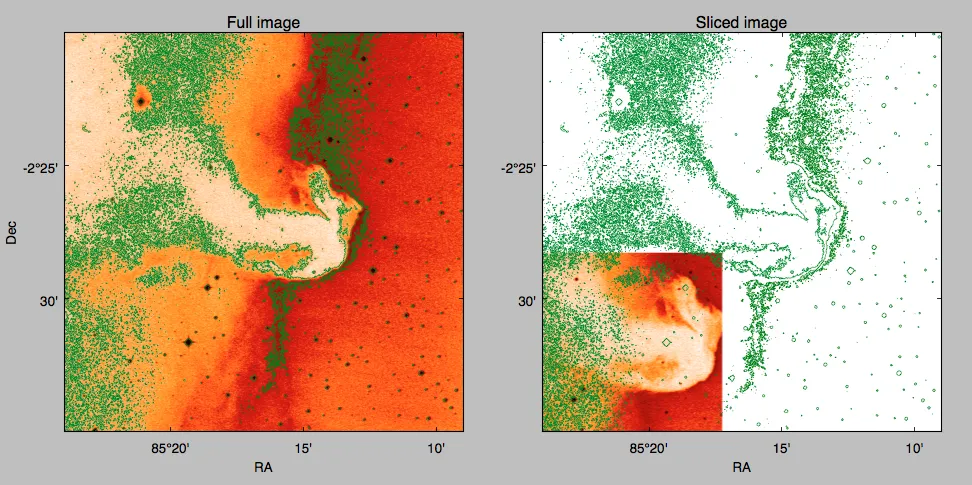
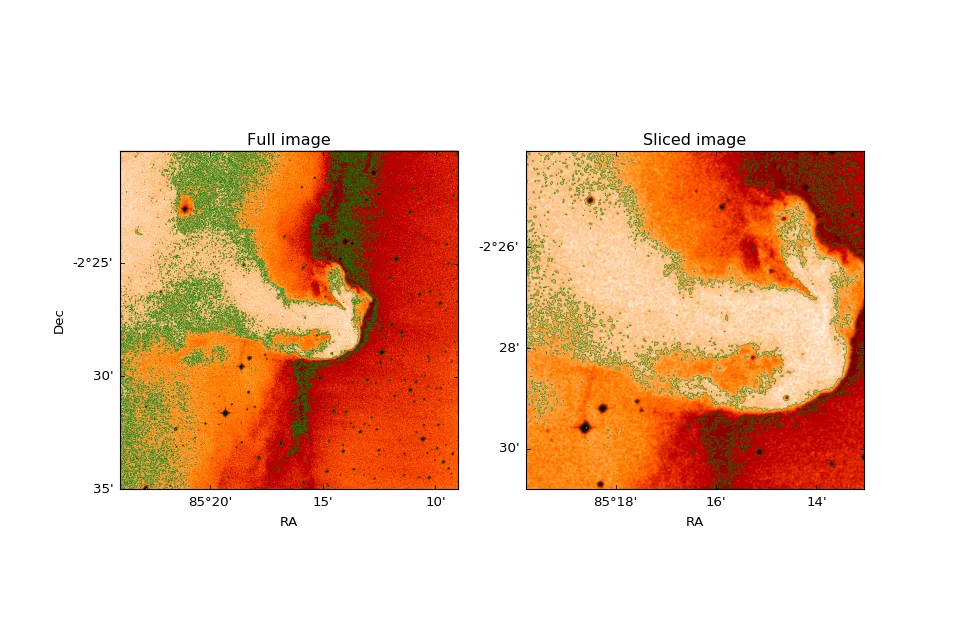
我的问题是,每当我从图像中切片数据(到我的感兴趣的区域),我就会失去与天空坐标的关联。这意味着切片后的图像不在正确的位置。
我已经改编了 astropy文档中的示例,以节省您处理我的数据的痛苦。(注意:我希望等高线覆盖更多区域而不是图像,无论解决方案是什么,都应适用于两个数据)
我尝试使用切片块的WCS坐标来解决这个问题,但我不确定能否将其传递到任何地方!
我的问题是,每当我从图像中切片数据(到我的感兴趣的区域),我就会失去与天空坐标的关联。这意味着切片后的图像不在正确的位置。
我已经改编了 astropy文档中的示例,以节省您处理我的数据的痛苦。(注意:我希望等高线覆盖更多区域而不是图像,无论解决方案是什么,都应适用于两个数据)
这是我遇到问题的代码:
from matplotlib import pyplot as plt
from astropy.io import fits
from astropy.wcs import WCS
from astropy.utils.data import download_file
import numpy as np

fits_file = 'http://data.astropy.org/tutorials/FITS-images/HorseHead.fits'
image_file = download_file(fits_file, cache=True)
hdu = fits.open(image_file)[0]
wmap = WCS(hdu.header)
data = hdu.data

fig = plt.figure()
ax1 = fig.add_subplot(121, projection=wmap)
ax2 = fig.add_subplot(122, projection=wmap)
# Scale input image
bottom, top = 0., 12000.
data = (((top - bottom) * (data - data.min())) / (data.max() - data.min())) + bottom


'''First plot'''
ax1.imshow(data, origin='lower', cmap='gist_heat_r')

# Now plot contours
xcont = np.arange(np.size(data, axis=1))
ycont = np.arange(np.size(data, axis=0))
colors = ['forestgreen','green', 'limegreen']
levels = [2000., 7000., 11800.]

ax1.contour(xcont, ycont, data, colors=colors, levels=levels, linewidths=0.5, smooth=16)
ax1.set_xlabel('RA')
ax1.set_ylabel('Dec')
ax1.set_title('Full image')

''' Second plot '''
datacut = data[250:650, 250:650]
ax2.imshow(datacut, origin='lower', cmap=cmap)
ax2.contour(xcont, ycont, data, colors=colors, levels=levels, linewidths=0.5, smooth=16)

ax2.set_xlabel('RA')
ax2.set_ylabel('')
ax2.set_title('Sliced image')
plt.show()
我尝试使用切片块的WCS坐标来解决这个问题,但我不确定能否将其传递到任何地方!
pixcoords = wcs.wcs_pix2world(zip(*[range(250,650),range(250,650)]),1)
.shape[0]非常整洁!)。谢谢你指出了reproject,我不知道它的存在,我肯定会需要它的!还有一件事;我试图在上面散布一个点,但坐标轴似乎没有映射到度数。例如绘制ax1.scatter(85.33, -2.5)应该出现在(85 20',-2 30'),但它离得很远。 - FriskyGrubpywcsgrid2(http://leejjoon.github.io/pywcsgrid2/)具有许多出色的重投影功能,我发现它比`astropy.WCS`更加灵活,但需要花费更多时间去学习。它也可以很好地叠加绘图。 - DathosPachy