计算随机抽取样本的平均值。

3

我正在尝试从我的数据库的2列(工作时间和访问患者的相对数量)中提取随机样本,然后我想逐步计算平均值。我的意思是,首先计算前2个样本之间的平均值,然后计算我刚刚计算出的平均值和第三个样本之间的平均值......以此类推。

这是否可能?是否有相应的函数?

感谢大家的帮助。

L.

以下是我提取样本的方法。

library(dplyr)

set.seed(2020)
obs <- rnorm(10, mean = 0, sd = 1)
time <- rnorm(10, mean = 0.5, sd = 1)
rdf <- data.frame(obs, time)
sample_n(rdf, 1)

p <- replicate(100, expr = (sample_n(rdf, 1) + sample_n(rdf, 1))/2)

人们经常使用像渐进和动态这样的词,它们几乎可以意味着任何事情,因此...什么也不是。这种情况需要使用术语“递归”。 - IRTFM
@IRTFM 有什么想法,为什么在下面的这个情况中递归比循环更快 - jay.sf
1
@jay.sf。不确定。但我也在想,使用“Recall”是否可以提高递归方法的性能。 - IRTFM
@IRTFM,“Recall”并没有显着改变性能。但一个非常有趣的功能,如果您重命名递归函数,它可以使其继续工作。谢谢! - jay.sf
3个回答

1
一种选择是使用for循环并确定您想要的样本数量。例如,如果我们想要取5个样本并逐步计算平均值,我们可以做一个循环,从第一个样本开始,并迭代选择下一个样本。然后在前一个平均值和下一个样本之间计算平均值:
set.seed(2020)
obs <- rnorm(10, mean = 0, sd = 1)
time <- rnorm(10, mean = 0.5, sd = 1)
rdf <- data.frame(obs, time)

nsamp <- 5  # number of samples 

mean_vect <- numeric(nsamp)  # create a vector to store the means

mean_vect[1] <- mean(sample_n(rdf, 1)$obs)  # mean of first sample as starting point

# start calculations to fifth sample iteratively
for (i in 2:nsamp) {
  # select the next sample
  next_samp <- sample_n(rdf, 1)
  # calculate the mean between the previous mean and the next sample
  mean_vect[i] <- mean(c(mean_vect[i-1], next_samp$obs))
}

# print the means
print(mean_vect)

[1] -1.13040590 -0.20491620  0.04831609  0.08284144  0.40170747

1
你可以定义一个递归函数(调用自身的函数)。
f <- function(S, R, i=1, cm=NULL, res=NULL, ...) {
  S <- rbind(cm, rdf[sample.int(nrow(rdf), 1), ])
  cm <- colMeans(S)
  res <- rbind(res, cm)
  return(if (i < R) {
    f(S, R=R, i=i + 1, cm=cm, res=res)  ## also `Recall(.)` instead of `f(.)`
  } else {
    `rownames<-`(as.data.frame(res), NULL)
  })
}

set.seed(42)
f(rdf[sample.int(nrow(rdf), 1), ], R=10)
#             obs        time
# 1   0.376972125 -0.35312282
# 2  -1.209781097  0.01180847
# 3  -0.416404486 -0.17065718
# 4   0.671363430 -0.97981606
# 5   0.394365109 -0.21075628
# 6  -0.368020398 -0.04117009
# 7  -0.033236012  0.68404454
# 8   0.042065388  0.62117402
# 9   0.209518756  0.13402560
# 10 -0.009929495 -1.20236950

你可能需要增加C语言栈大小

但你也可以使用for循环。

R <- 10
res1 <- matrix(nrow=0, ncol=2)

set.seed(42)
for (i in seq_len(R - 1)) {
  if (nrow(res1) == 0) {
    res1 <- rdf[sample.int(nrow(rdf), 1), ]
  }
  S <- rdf[sample.int(nrow(rdf), 1), ]
  res1 <- rbind(res1, colMeans(rbind(res1[nrow(res1), ], S)))
}
res1
#             obs        time
# 1   0.376972125 -0.35312282
# 2  -1.209781097  0.01180847
# 3  -0.416404486 -0.17065718
# 4   0.671363430 -0.97981606
# 5   0.394365109 -0.21075628
# 6  -0.368020398 -0.04117009
# 7  -0.033236012  0.68404454
# 8   0.042065388  0.62117402
# 9   0.209518756  0.13402560
# 10 -0.009929495 -1.20236950

这里是两个版本的快速基准测试(R=2K),递归似乎快了近一倍。

# Unit: milliseconds
#      expr      min       lq     mean   median        uq       max neval cld
# recursive 577.0595 582.0189 587.3052 586.9783  592.4281  597.8778     3  a 
#  for-loop 991.4360 993.7170 997.2436 995.9980 1000.1473 1004.2966     3   b

数据:

rdf <- structure(list(obs = c(0.376972124936433, 0.301548373935665, 
-1.0980231706536, -1.13040590360378, -2.79653431987176, 0.720573498411587, 
0.93912102300901, -0.229377746707471, 1.75913134696347, 0.117366786802848
), time = c(-0.353122822287008, 1.40925918161821, 1.69637295955276, 
0.128416096258652, 0.376739766712564, 2.30004311672545, 2.20399587729432, 
-2.53876460529759, -1.78897494991878, 0.558303494992923)), class = "data.frame", row.names = c(NA, 
-10L))
0

另一种方法(使用您的示例数据rdf):

  • 创建一个函数mean_of_random_pair(xs),它从集合xs中随机选择两个项目并计算它们的平均值:
mean_of_random_pair <- function(xs){
  xs |> sample(size = 2) |> mean(na.rm = TRUE)
}

创建一个名为 cumulative_mean 的函数,它计算整体均值 X,其中 X 是现有 X 和新项 x 的平均值:
cumulative_mean <- function(xs){
  xs |> Reduce(f = \(X, x) mean(c(X, x)),
               accumulate = TRUE
               )
}

将上述函数链接成管道并在集合 rdf$obs 上运行它 runs 次:

runs = 100

1:runs |>
  Map(f = \(i) mean_of_random_pair(rdf$obs)) |>
  cumulative_mean()

输出(迭代平均序列):

[1]  1.1000858  0.8557774  0.3041130  0.4262881 -0.4658256
# ...

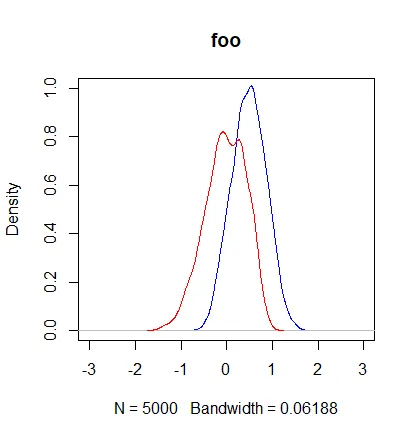
检查输出(针对5000次模拟运行):

runs = 5e3
set.seed(4711)
densities <- 
  list(obs = 'obs', time = 'time') |>
  map(\(var){
    1:runs |>
      Map(f = \(i) mean_of_random_pair(rdf[[var]])) |>
      cumulative_mean() |>
      density()
  })

densities$time |> plot(col = 'blue', ylim = c(0, 1), xlim = c(-3, 3), main = 'foo')
densities$obs |> lines(col = 'red')

enter image description here


网页内容由stack overflow 提供, 点击上面的
可以查看英文原文,
原文链接