有没有办法根据某个变量的值改变leaflet标记的颜色。例如,在下面的地图中,我希望根据 mag 变量分配标记颜色:
library(leaflet)

data(quakes)

# Show first 20 rows from the `quakes` dataset
leaflet(data = quakes[1:20,]) %>% addTiles() %>%
  addMarkers(~long, ~lat, popup = ~as.character(mag))
有没有办法根据某个变量的值改变leaflet标记的颜色。例如,在下面的地图中,我希望根据 mag 变量分配标记颜色:
library(leaflet)
data(quakes)
# Show first 20 rows from the `quakes` dataset
leaflet(data = quakes[1:20,]) %>% addTiles() %>%
addMarkers(~long, ~lat, popup = ~as.character(mag))
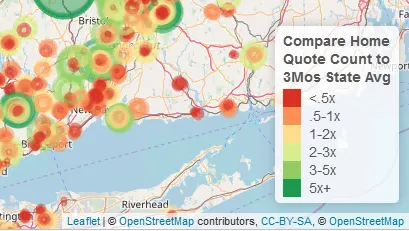
我经常使用圆形标记,因为您可以根据其他变量更改大小和颜色。例如,我使用以下代码从连续变量创建了一个分箱变量:
# first cut the continuous variable into bins
# these bins are now factors
last$BeatHomeLvl <- cut(last$BeatHome,
                        c(0,.5,1,2,3,5,100), include.lowest = T,
                        labels = c('<.5x', '.5-1x', '1-2x', '2-3x', '3-5x','5x+'))

# then assign a palette to this using colorFactor
# in this case it goes from red for the smaller values to yellow and green
# standard stoplight for bad, good, and best
beatCol <- colorFactor(palette = 'RdYlGn', last$BeatHomeLvl)
m1 <- leaflet() %>%
  addTiles() %>%
  addProviderTiles(providers$OpenStreetMap, group = 'Open SM')  %>%
  addProviderTiles(providers$Stamen.Toner, group = 'Toner')  %>%
  addProviderTiles(providers$Esri.NatGeoWorldMap, group = 'NG World') %>%
  setView(lng = -72, lat = 41, zoom = 8) %>%

      addCircleMarkers(data = Jun, lat = ~Lat, lng = ~Lon,
                       color = ~beatCol(BeatHomeLvl), popup = Jun$Popup,
                       radius = ~sqrt(BeatHome*50), group = 'Home - Jun') %>%
  addLegend('bottomright', pal = beatCol, values = last$BeatHomeLvl,
            title = 'Compare Home<br>Quote Count to<br>3Mos State Avg',
            opacity = 1)
这将为您提供基于变量的彩色编码和大小不同的圆圈,以及一个漂亮的图例。
library(dplyr)
library(leaflet)
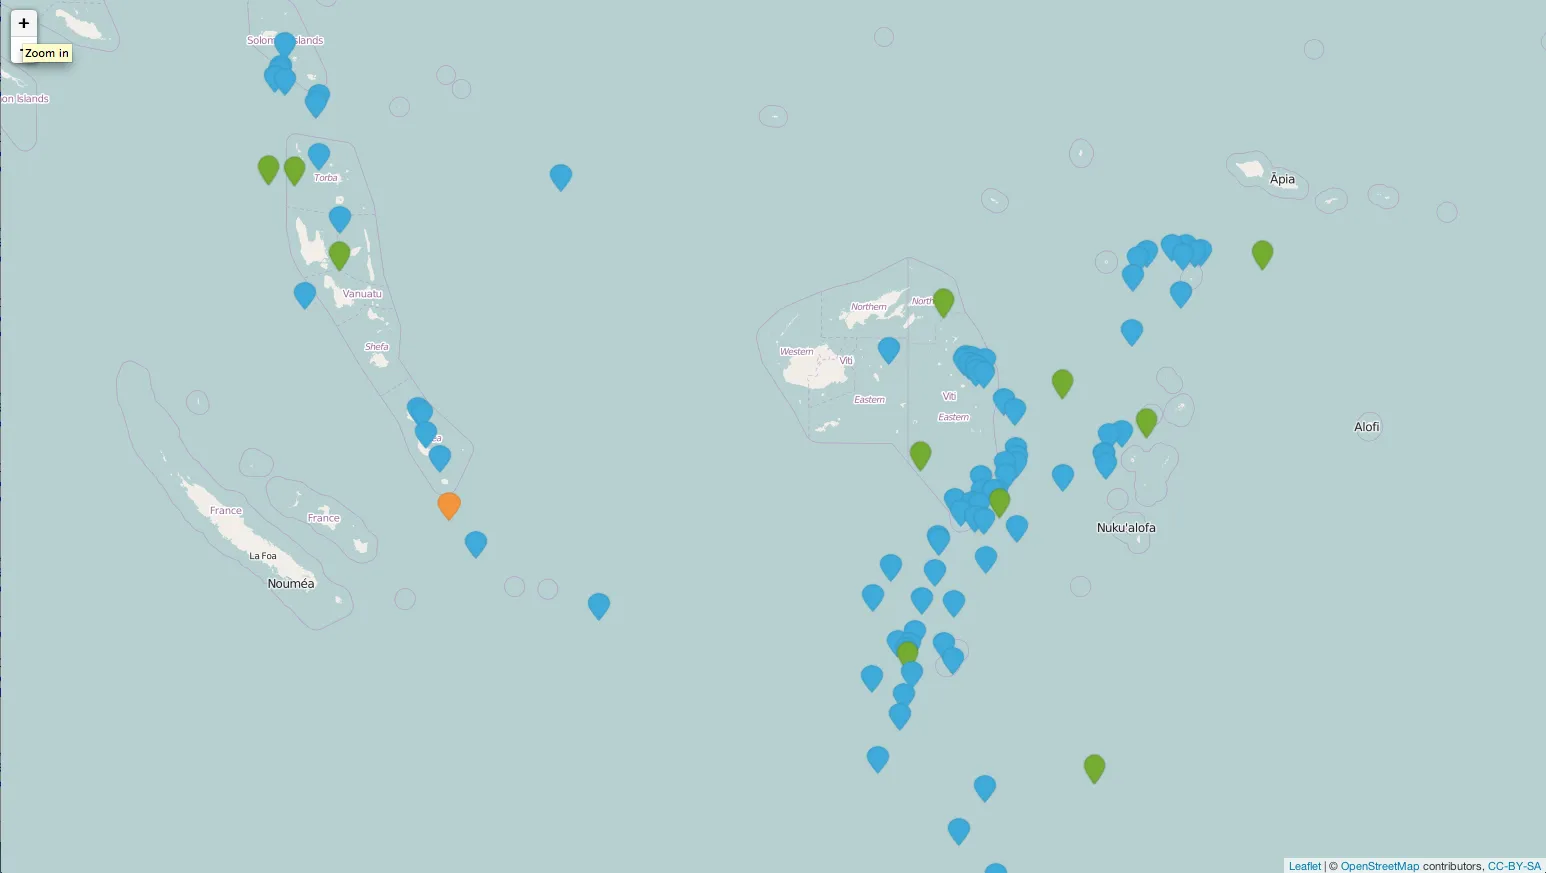
mutate(quakes, group = cut(mag, breaks = c(0, 5, 6, Inf), labels = c("blue", "green", "orange"))) -> mydf
### I edit this png file and created my own marker.
### https://raw.githubusercontent.com/lvoogdt/Leaflet.awesome-markers/master/dist/images/markers-soft.png
quakeIcons <- iconList(blue = makeIcon("/Users/jazzurro/Documents/Stack Overflow/blue.png", iconWidth = 24, iconHeight =32),
green = makeIcon("/Users/jazzurro/Documents/Stack Overflow/green.png", iconWidth = 24, iconHeight =32),
orange = makeIcon("/Users/jazzurro/Documents/Stack Overflow/orange.png", iconWidth = 24, iconHeight =32))
leaflet(data = mydf[1:100,]) %>%
addTiles() %>%
addMarkers(icon = ~quakeIcons[group])
library(leaflet)

icon.glyphicon <- makeAwesomeIcon(icon= 'flag', markerColor = 'blue', iconColor = 'black')
icon.fa <- makeAwesomeIcon(icon = 'flag', markerColor = 'red', library='fa', iconColor = 'black')
icon.ion <- makeAwesomeIcon(icon = 'home', markerColor = 'green', library='ion')

# Marker + Label
leaflet() %>% addTiles() %>%
  addAwesomeMarkers(
    lng=-118.456554, lat=34.078039,
    label='This is a label',
    icon = icon.glyphicon)

leaflet() %>% addTiles() %>%
  addAwesomeMarkers(
    lng=-118.456554, lat=34.078039,
    label='This is a label',
    icon = icon.fa)

leaflet() %>% addTiles() %>%
  addAwesomeMarkers(
    lng=-118.456554, lat=34.078039,
    label='This is a label',
    icon = icon.ion)

# Marker + Static Label using custom label options
leaflet() %>% addTiles() %>%
  addAwesomeMarkers(
    lng=-118.456554, lat=34.078039,
    label='This is a static label',
    labelOptions = labelOptions(noHide = T),
    icon = icon.fa)
addAwesomeMarkers(),所以我无法运行上面的代码。 - jazzurroL.Marker使用了两张图片(一个用于标记,一个用于阴影),所以不能直接更改。不过你可以使用自己的图片,Leaflet网站的教程中有一篇很好的文章介绍了这个主题: