我曾经处理过一个类似的问题,持续了几天。最终我解决了它。首先,注意ColumnDataSource函数中的方括号[]。数据允许多个图像。因此,在回调函数中,您应该使用[0]来获取一个图像的数据。此外,源图像中使用的'x'和'y'与图像的位置x=[0]和y[0]冲突,因此我使用了xx和yy。我想提到的是,我从tobyhodges的示例
color_sliders.py中借用了代码:一种将滑块信息推送到已定义的回调函数的方法。这里是代码:
import numpy as np
from bokeh.plotting import figure, show, output_file
from bokeh.models import CustomJS, ColumnDataSource, Slider
from bokeh.io import vform
N = 100
x = np.linspace(0, 10, N)
y = np.linspace(0, 10, N)
xx, yy = np.meshgrid(x, y)
d = np.sin(xx)*np.cos(yy)
output_file("image.html", title="image.py example")
source = ColumnDataSource(data={'d': [d], 'xx': [x], 'yy': [y]})
p = figure(x_range=[0, 10], y_range=[0, 10])
p.image(image="d", x=[0], y=[0], dw=[10], dh=[10], palette="Spectral11",source=source)
callback = CustomJS(args=dict(source=source), code="""
var xx = source.get('data')['xx'][0];
var yy = source.get('data')['yy'][0];
var d = source.get('data')['d'][0];
var f = slider.get('value');
for (var i = 0; i < xx.length; i++) {
for (var j = 0; j < yy.length; j++){
d[i][j] = Math.sin(f * xx[i]) * Math.cos(yy[j]);
}
}
source.trigger('change');
""")
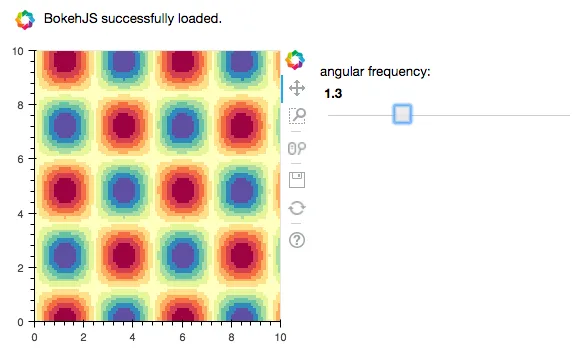
slider = Slider(start=0.1, end=4, value=1, step=.1, title="angular frequency", callback=callback)
callback.args['slider'] = slider
layout = vform(slider, p)
show(layout)
为了避免在最新版本的bokeh中出现弃用警告(我刚安装的版本是0.12.3),我修改了这段代码。在这个代码中,我没有使用图像的数据源。在
CustomJS 中,我传递了图像句柄 "im" 并获取了数据源作为
im.data_source。
import numpy as np
import bokeh
import bokeh.plotting

N = 100

x = np.linspace(0, 10, N)
y = np.linspace(0, 10, N)
xx, yy = np.meshgrid(x, y)
d = np.sin(xx)*np.cos(yy)

source = bokeh.models.ColumnDataSource(data={'x': [x], 'y': [y]})

p = bokeh.plotting.figure(x_range=[0, 10], y_range=[0, 10])
im = p.image(image=[d], x=[0], y=[0], dw=[10], dh=[10], palette="Spectral11")

callback = bokeh.models.CustomJS(args=dict(source=source,im=im), code="""
        var x = source.data['x'][0];
        var y = source.data['y'][0];
        var image_source = im.data_source;
        var d = image_source.data['image'][0];
        var f = slider.value;
        for (var i = 0; i < x.length; i++) {
            for (var j = 0; j < y.length; j++){
                d[i][j] = Math.sin(f * x[i]) * Math.cos(f * y[j]);
            }
        }
        image_source.trigger('change');
    """)

slider = bokeh.models.Slider(start=0.1, end=4, value=1, step=.1,
                             title="angular frequency", callback=callback)
callback.args['slider'] = slider
layout = bokeh.models.layouts.Column(slider, p)

bokeh.io.output_file("image.html", title="image.py example")
bokeh.io.save(layout)
Bokeh版本0.12.4更新:
更改:输出现在适用于Jupyter笔记本电脑。要获取html页面,只需按照以前的版本操作即可。此bokeh版本中的新功能:JavaScript上的数组现在是1D数组。
import numpy as np
import bokeh
import bokeh.plotting

N = 100

x = np.linspace(0, 10, N)
y = np.linspace(0, 10, N)
xx, yy = np.meshgrid(x, y)
d = np.sin(xx)*np.cos(yy)

source = bokeh.models.ColumnDataSource(data={'x': [x], 'y': [y]})

p = bokeh.plotting.figure(plot_width=300, plot_height=300,x_range=[0, 10], y_range=[0, 10])
im = p.image(image=[d], x=[0], y=[0], dw=[10], dh=[10], palette="Spectral11")

callback = bokeh.models.CustomJS(args=dict(source=source,im=im), code="""
        var x = source.data['x'][0];
        var y = source.data['y'][0];
        var image_source = im.data_source;
        var d = image_source.data['image'][0];
        var f = slider.value;
        for (var j = 0; j < y.length; j++){
            for (var i = 0; i < x.length; i++) {
                d[j*y.length + i] = Math.sin(f * x[i]) * Math.cos(f * y[j]);
            }
        }
        image_source.trigger('change');
    """)

slider = bokeh.models.Slider(start=0.1, end=4, value=1, step=.1,
                             title="angular frequency",callback=callback)
callback.args['slider'] = slider
layout = bokeh.models.layouts.Row(p,slider)

bokeh.io.output_notebook()
bokeh.io.show(layout)
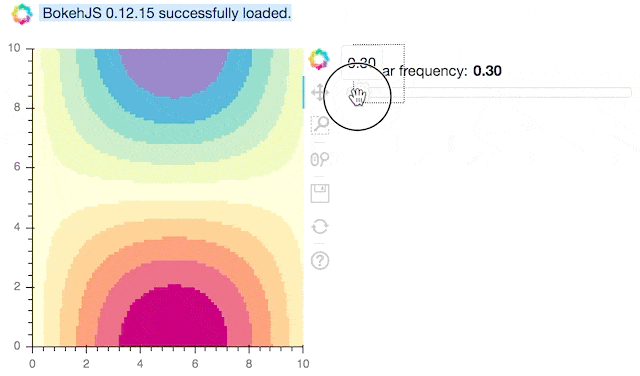
bokeh版本0.12.15更新:
import numpy as np
import bokeh
import bokeh.plotting

N = 100

x = np.linspace(0, 10, N)
y = np.linspace(0, 10, N)
xx, yy = np.meshgrid(x, y)
d = np.sin(xx)*np.cos(yy)

source = bokeh.models.ColumnDataSource(
    data=dict(values=[d],x_vals=[x],y_vals=[y]))

p = bokeh.plotting.figure(plot_width=300, plot_height=300,
    x_range=[0, 10], y_range=[0, 10])
p.image(image='values', x=0, y=0, dw=10, dh=10,
    palette="Spectral11", source=source)

callback = bokeh.models.CustomJS(args=dict(source=source), code="""
    var f = slider.value;
    var x = source.data['x_vals'][0];
    var y = source.data['y_vals'][0];
    var d = source.data['values'][0];
    for (var j = 0; j < y.length; j++){
        for (var i = 0; i < x.length; i++) {
            d[j*y.length + i] = Math.sin(f*x[i]) * Math.cos(f*y[j]);
        }
    }
    source.change.emit();
    """)

slider = bokeh.models.Slider(start=0.1, end=4, value=1, step=.1,
    title="angular frequency",callback=callback)
callback.args['slider'] = slider
layout = bokeh.models.layouts.Row(p,slider)

bokeh.io.output_notebook()
bokeh.io.show(layout)
更新 Bokeh 版本至 2.4.2:
最近版本有一些变化。适用于 2022 年 2 月最新版本 2.4.2 的代码如下。
import numpy as np
import bokeh
import bokeh.plotting
N = 100
x = np.linspace(0, 10, N)
y = np.linspace(0, 10, N)
xx, yy = np.meshgrid(x, y)
d = np.sin(xx)*np.cos(yy)
source = bokeh.models.ColumnDataSource(data=dict(
x_values=x,
y_values=y,
))
source_im = bokeh.models.ColumnDataSource(data=dict(
image=[d],
x=[0],
y=[0],
dw = [10],
dh=[10]
))
p = bokeh.plotting.figure(plot_width=300, plot_height=300,
x_range=[0, 10], y_range=[0, 10])
im = p.image(source=source_im, palette="Spectral11")
slider_callback = bokeh.models.CustomJS(args=dict(
source=source,source_im=source_im), code="""
var x = source.data['x_values'];
var y = source.data['y_values'];
var d = source_im.data['image'][0];
var f = slider.value;
for (var j = 0; j < y.length; j++){
for (var i = 0; i < x.length; i++) {
d[j*y.length + i] = Math.sin(f * x[i]) * Math.cos(f * y[j]);
}
}
source_im.change.emit();
""")
slider = bokeh.models.Slider(start=0.1, end=4, value=1, step=.1,
title="angular frequency")
slider.js_on_change('value', slider_callback)
slider_callback.args['slider'] = slider
layout = bokeh.models.layouts.Row(p,slider)
bokeh.io.output_notebook()
bokeh.io.show(layout)