在之前的一个问题(colobar label matplotlib in ImageGrid)中,有一种方法可以向colorbar添加标签,但是这种方法在当前版本中好像已经失效了。
我尝试过的平台有:
- Mac w/ Canopy: - python: 2.7 - matplotlib: 1.4.3-6 - Linux: - python: 2.7 - matplotlib: 1.3.1
下面是来自之前问题的代码,并加入了在iPython笔记本中运行所需的额外代码:
代码的错误消息格式如下:
自从最初的问题被提出以来,matplotlib接口有改变吗?如果是这样,我该如何添加colorbar标签?
我尝试过的平台有:
- Mac w/ Canopy: - python: 2.7 - matplotlib: 1.4.3-6 - Linux: - python: 2.7 - matplotlib: 1.3.1
下面是来自之前问题的代码,并加入了在iPython笔记本中运行所需的额外代码:
import matplotlib.pyplot as plt
from mpl_toolkits.axes_grid1 import AxesGrid
def get_demo_image():
import numpy as np
from matplotlib.cbook import get_sample_data
f = get_sample_data("axes_grid/bivariate_normal.npy", asfileobj=False)
z = np.load(f)
# z is a numpy array of 15x15
return z, (-3,4,-4,3)
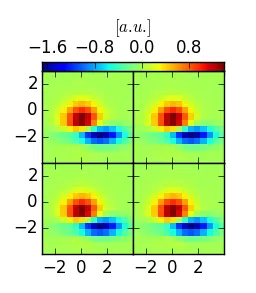
def demo_grid_with_single_cbar(fig):
"""
A grid of 2x2 images with a single colorbar
"""
grid = AxesGrid(fig, 132, # similar to subplot(132)
nrows_ncols = (2, 2),
axes_pad = 0.0,
share_all=True,
label_mode = "L",
cbar_location = "top",
cbar_mode="single",
)
Z, extent = get_demo_image()
for i in range(4):
im = grid[i].imshow(Z, extent=extent, interpolation="nearest")
#plt.colorbar(im, cax = grid.cbar_axes[0])
#grid.cbar_axes[0].colorbar(im)
cbar = grid.cbar_axes[0].colorbar(im)
cbar.ax.set_label_text("$[a.u.]$")
for cax in grid.cbar_axes:
cax.toggle_label(False)
# This affects all axes as share_all = True.
grid.axes_llc.set_xticks([-2, 0, 2])
grid.axes_llc.set_yticks([-2, 0, 2])
#
F = plt.figure(1, (10.5, 2.5))
F.subplots_adjust(left=0.05, right=0.95)
demo_grid_with_single_cbar(F)
plt.draw()
plt.show()
代码的错误消息格式如下:
---------------------------------------------------------------------------
AttributeError                            Traceback (most recent call last)
<ipython-input-1-60ebdb832699> in <module>()
     40 F = plt.figure(1, (10.5, 2.5))
     41 F.subplots_adjust(left=0.05, right=0.95)
---> 42 demo_grid_with_single_cbar(F)
     43
     44 plt.draw()

<ipython-input-1-60ebdb832699> in demo_grid_with_single_cbar(fig)
     29     #grid.cbar_axes[0].colorbar(im)
     30     cbar = grid.cbar_axes[0].colorbar(im)
---> 31     cbar.ax.set_label_text("$[a.u.]$")
     32
     33     for cax in grid.cbar_axes:

AttributeError: 'CbarAxes' object has no attribute 'set_label_text'
自从最初的问题被提出以来,matplotlib接口有改变吗?如果是这样,我该如何添加colorbar标签?