我希望您能提供一种自动将基础地图绘制在我的坐标数据中心的解决方案。
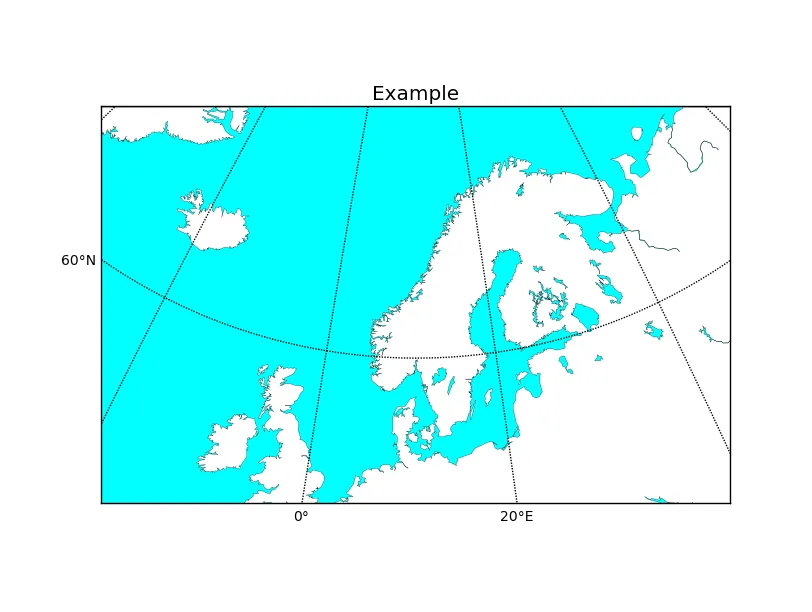
我已经实现了自动居中,但是结果区域比实际数据使用的区域大得多。我希望绘图被限制在绘图坐标而不是从纬度/经度边界划定的区域内。
我正在使用John Cook的代码计算球面上两点之间的距离。
首次尝试:
这是我最初的脚本。它导致宽度和高度太小,无法容纳数据区域,并且中心纬度(lat0)偏南。
我已经实现了自动居中,但是结果区域比实际数据使用的区域大得多。我希望绘图被限制在绘图坐标而不是从纬度/经度边界划定的区域内。
我正在使用John Cook的代码计算球面上两点之间的距离。
首次尝试:
这是我最初的脚本。它导致宽度和高度太小,无法容纳数据区域,并且中心纬度(lat0)偏南。
from mpl_toolkits.basemap import Basemap
import matplotlib.pyplot as plt
import numpy as np
import sys
import csv
import spheredistance as sd


print '\n'
if len(sys.argv) < 3:
    print >>sys.stderr,'Usage:',sys.argv[0],'<datafile> <#rows to skip>'
    sys.exit(1)
print '\n'

dataFile = sys.argv[1]
dataStream = open(dataFile, 'rb')
dataReader = csv.reader(dataStream,delimiter='\t')
numRows = sys.argv[2]

dataValues = []
dataLat = []
dataLon = []

print 'Plotting Data From: '+dataFile

dataReader.next()
for row in dataReader:
    dataValues.append(row[0])
    dataLat.append(float(row[1]))
    dataLon.append(float(row[2]))

# center and set extent of map
earthRadius = 6378100 #meters
factor = 1.00

lat0new = ((max(dataLat)-min(dataLat))/2)+min(dataLat)
lon0new = ((max(dataLon)-min(dataLon))/2)+min(dataLon)

mapH = sd.distance_on_unit_sphere(max(dataLat),lon0new,
            min(dataLat),lon0new)*earthRadius*factor

mapW = sd.distance_on_unit_sphere(lat0new,max(dataLon),
            lat0new,min(dataLon))*earthRadius*factor

# setup stereographic basemap.
# lat_ts is latitude of true scale.
# lon_0,lat_0 is central point.
m = Basemap(width=mapW,height=mapH,
            resolution='l',projection='stere',\
            lat_0=lat0new,lon_0=lon0new)

#m.shadedrelief()
m.drawcoastlines(linewidth=0.2)
m.fillcontinents(color='white', lake_color='aqua')

#plot data points (omitted due to ownership)
#x, y = m(dataLon,dataLat)
#m.scatter(x,y,2,marker='o',color='k')

# draw parallels and meridians.
m.drawparallels(np.arange(-80.,81.,20.), labels=[1,0,0,0], fontsize=10)
m.drawmeridians(np.arange(-180.,181.,20.), labels=[0,0,0,1], fontsize=10)
m.drawmapboundary(fill_color='aqua')

plt.title("Example")
plt.show()
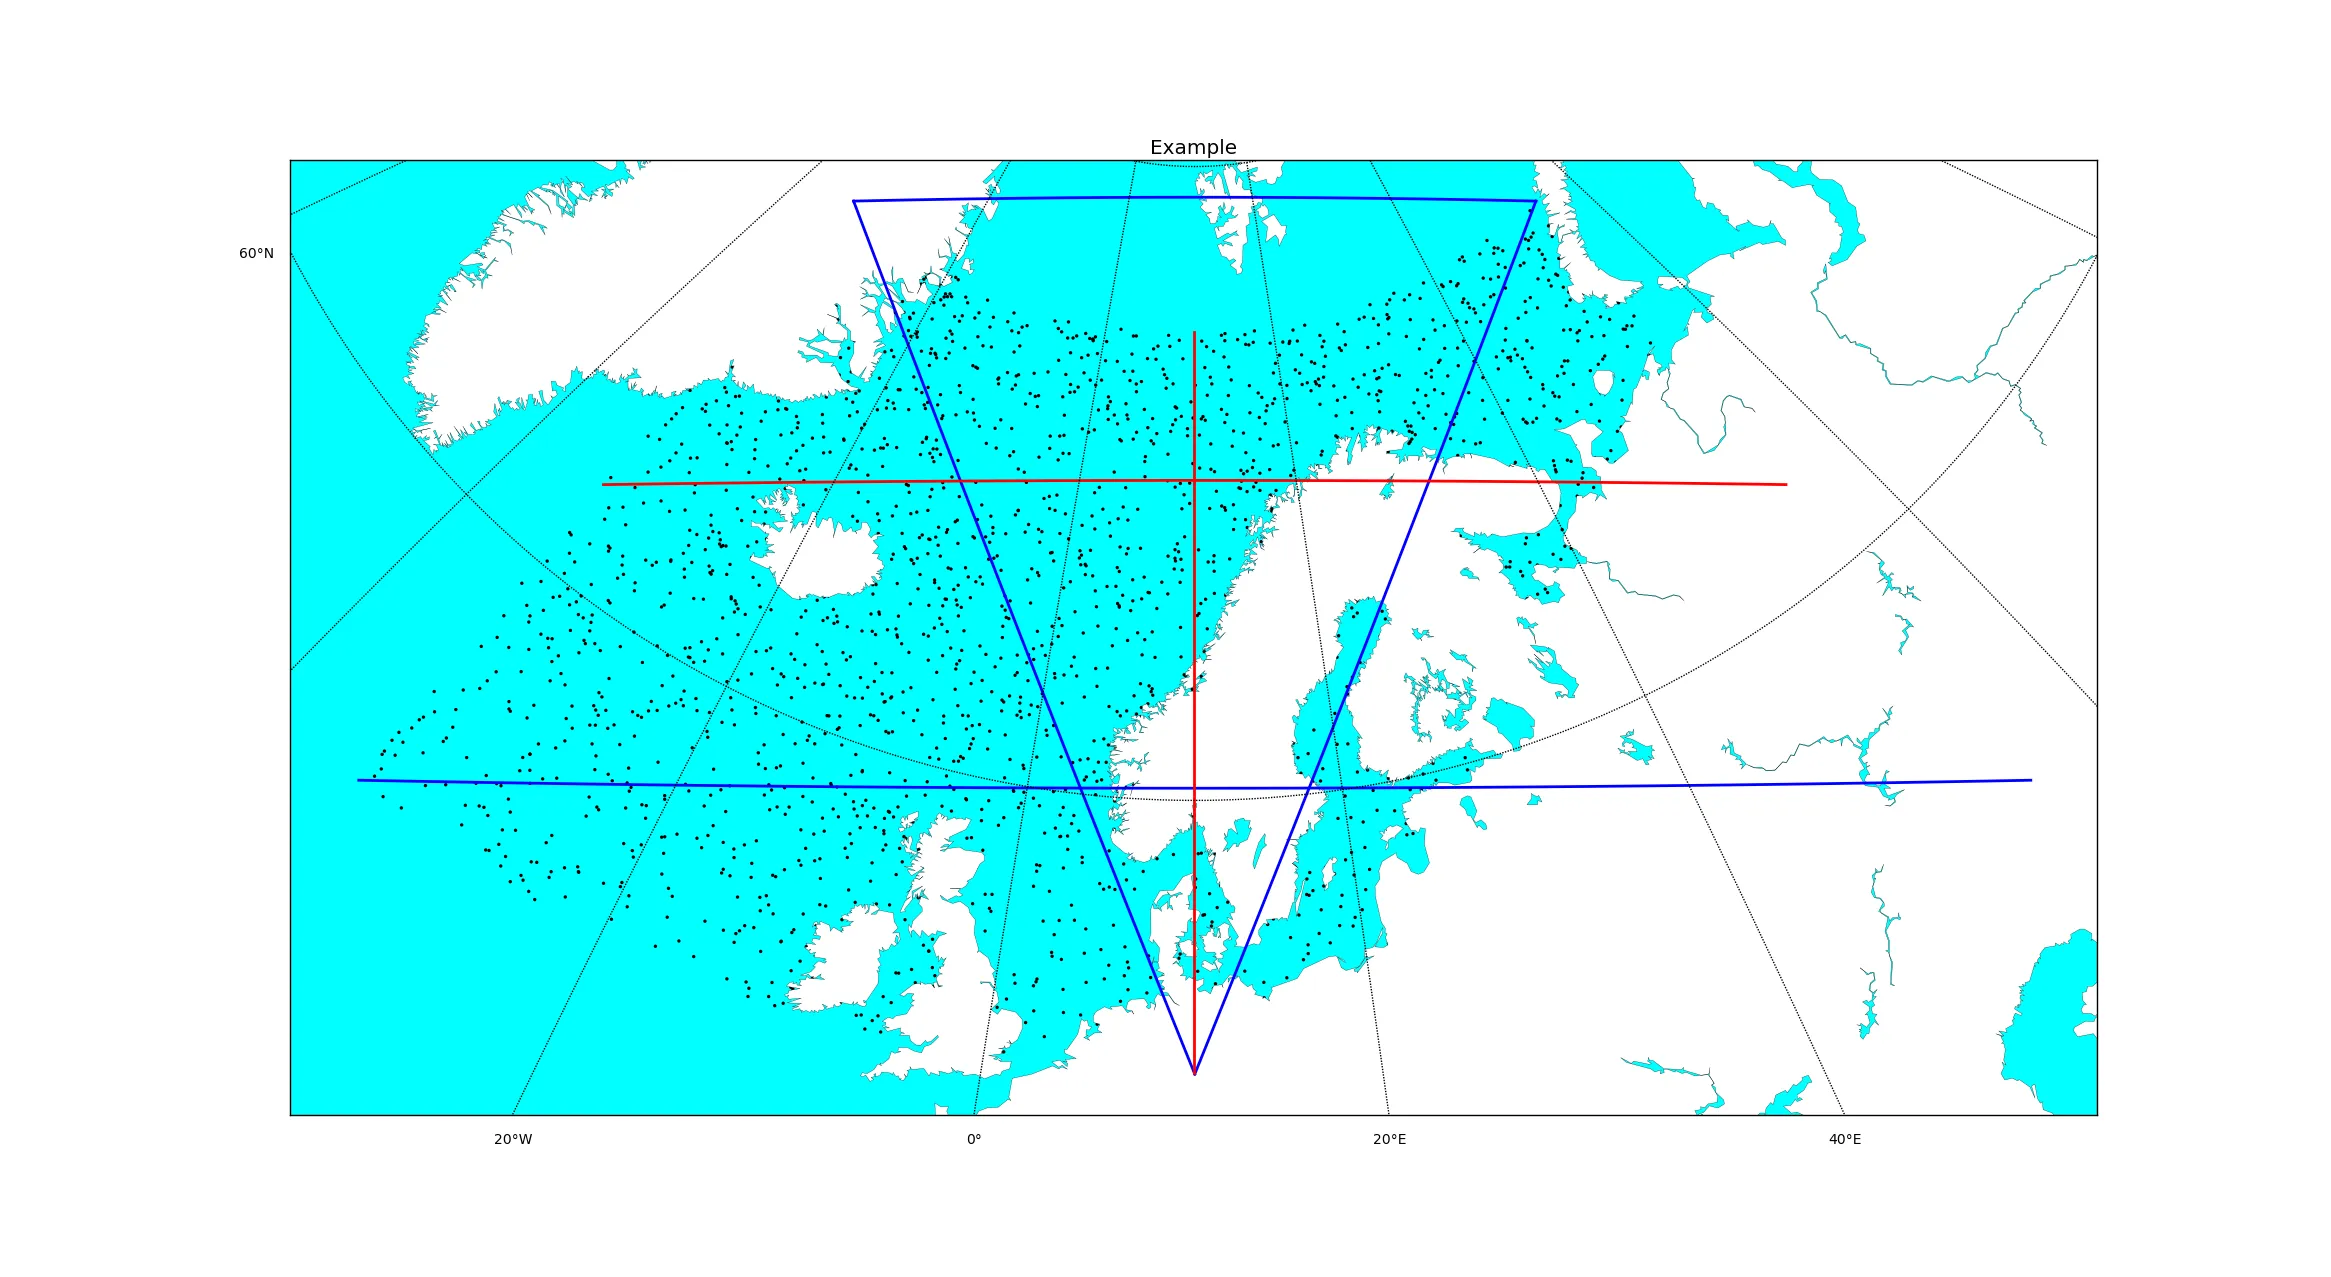 我通过在最南端的纬度处使用经度差值来更正经度(蓝色水平线)。