有人成功地为 Go 单元测试生成代码覆盖率吗?我在网上找不到相应的工具。
如何在Go中衡量测试覆盖率
205
- Georgi Atsev
1
1针对VSCode用户:https://github.com/golang/vscode-go/blob/master/docs/features.md#code-coverage - Nathaniel Jones
16个回答
222
请注意 Go 1.2 (Q4 2013, rc1 is available) 现在会显示 test coverage results:
更新于2023年3月,Go 1.20:"为Go集成测试添加代码覆盖率" 表明您现在可以使用"go build -cover"构建具有覆盖仪器的程序,然后将这些仪器化的二进制文件输入到集成测试中,以扩展覆盖测试的范围。
go test的一个主要新功能是,它现在可以计算并显示测试覆盖率结果,而且还可以借助一个新的、单独安装的 "go tool cover" 程序来实现。
cover工具是go.tools子存储库 的一部分。可以通过运行以下命令进行安装:$ go get golang.org/x/tools/cmd/covercover 工具有两个作用:
首先,当给 "
go test" 带上-cover标志时,它会自动运行以重写包的源代码并插入插桩语句。然后像往常一样编译和运行测试,并报告基本的覆盖率统计信息:$ go test -coverprofile fmtcoverage.html fmt ok fmt 0.060s coverage: 91.4% of statements $
其次,为了得到更详细的报告,不同的 "go test" 标志可以创建一个覆盖率文件,然后使用 "
go tool cover" 调用 cover 程序进行分析。
The latest versions of Go (2013/09/19) use:
go test -coverprofile <filename> <package name>Details on how to generate and analyze coverage statistics can be found by running the commands
$ go help testflag
$ go tool cover -help
go test -coverprofile cover.outand then
go tool cover -html=cover.outopenscover.outin your default browserI don't even want to wait for the browser to open, so I defined this alias:
alias gc=grep -v -e " 1$" cover.outThat I just type
gc, and have a list of all the lines not yet covered (here: with acoverage.outline not ending with "1").
更新于2022年,可能适用于Go 1.19
提案:将Go的代码覆盖测试扩展到应用程序
虽然现有的基于"
go test"的覆盖率工作流将继续得到支持,但该提案旨在将覆盖率作为"go build"的新构建模式添加进来。就像用户可以使用"
go build -race"构建一个带有竞态检测器的可执行文件一样,使用"go build -cover"将可以构建一个覆盖率检测器的可执行文件。支持合并在不同GOOS/GOARCH环境中生成的覆盖率文件。
更新于2023年3月,Go 1.20:"为Go集成测试添加代码覆盖率" 表明您现在可以使用"go build -cover"构建具有覆盖仪器的程序,然后将这些仪器化的二进制文件输入到集成测试中,以扩展覆盖测试的范围。
- VonC
9
2请注意,最新版本的Go(2013/09/19)使用
go test -coverprofile <filename> <package name>。 - Frank Shearar@FrankShearar 好的。我已经将您的评论包含在答案中,以增加其可见性。 - VonC
2运行命令
go test -coverprofile cover.out,然后执行 go tool cover -html=cover.out -o cover.html,最后在浏览器中打开 cover.html。 - Ivan Black1@VonC
go tool cover -html=cover.out 会自动打开浏览器,但在我的系统上无法正常工作。我更喜欢保持浏览器打开,并在需要时刷新页面。 - Ivan Black"go tool cover"已经迁移到新的URL,请使用命令"go get golang.org/x/tools/cmd/cover"。 - shawnzhu
显示剩余4条评论
69
Go语言提供了非常好用的测试和覆盖率工具。虽然所有的Go工具都有很好的文档,go tool cover -help,但我建议阅读官方Go博客上的覆盖率文章。这篇文章有大量的示例,我强烈推荐!
我在我的~/.bash_profile中有这个函数(你可以将其粘贴到终端中尝试)。
cover () {
    t="/tmp/go-cover.$$.tmp"
    go test -coverprofile=$t $@ && go tool cover -html=$t && unlink $t
}
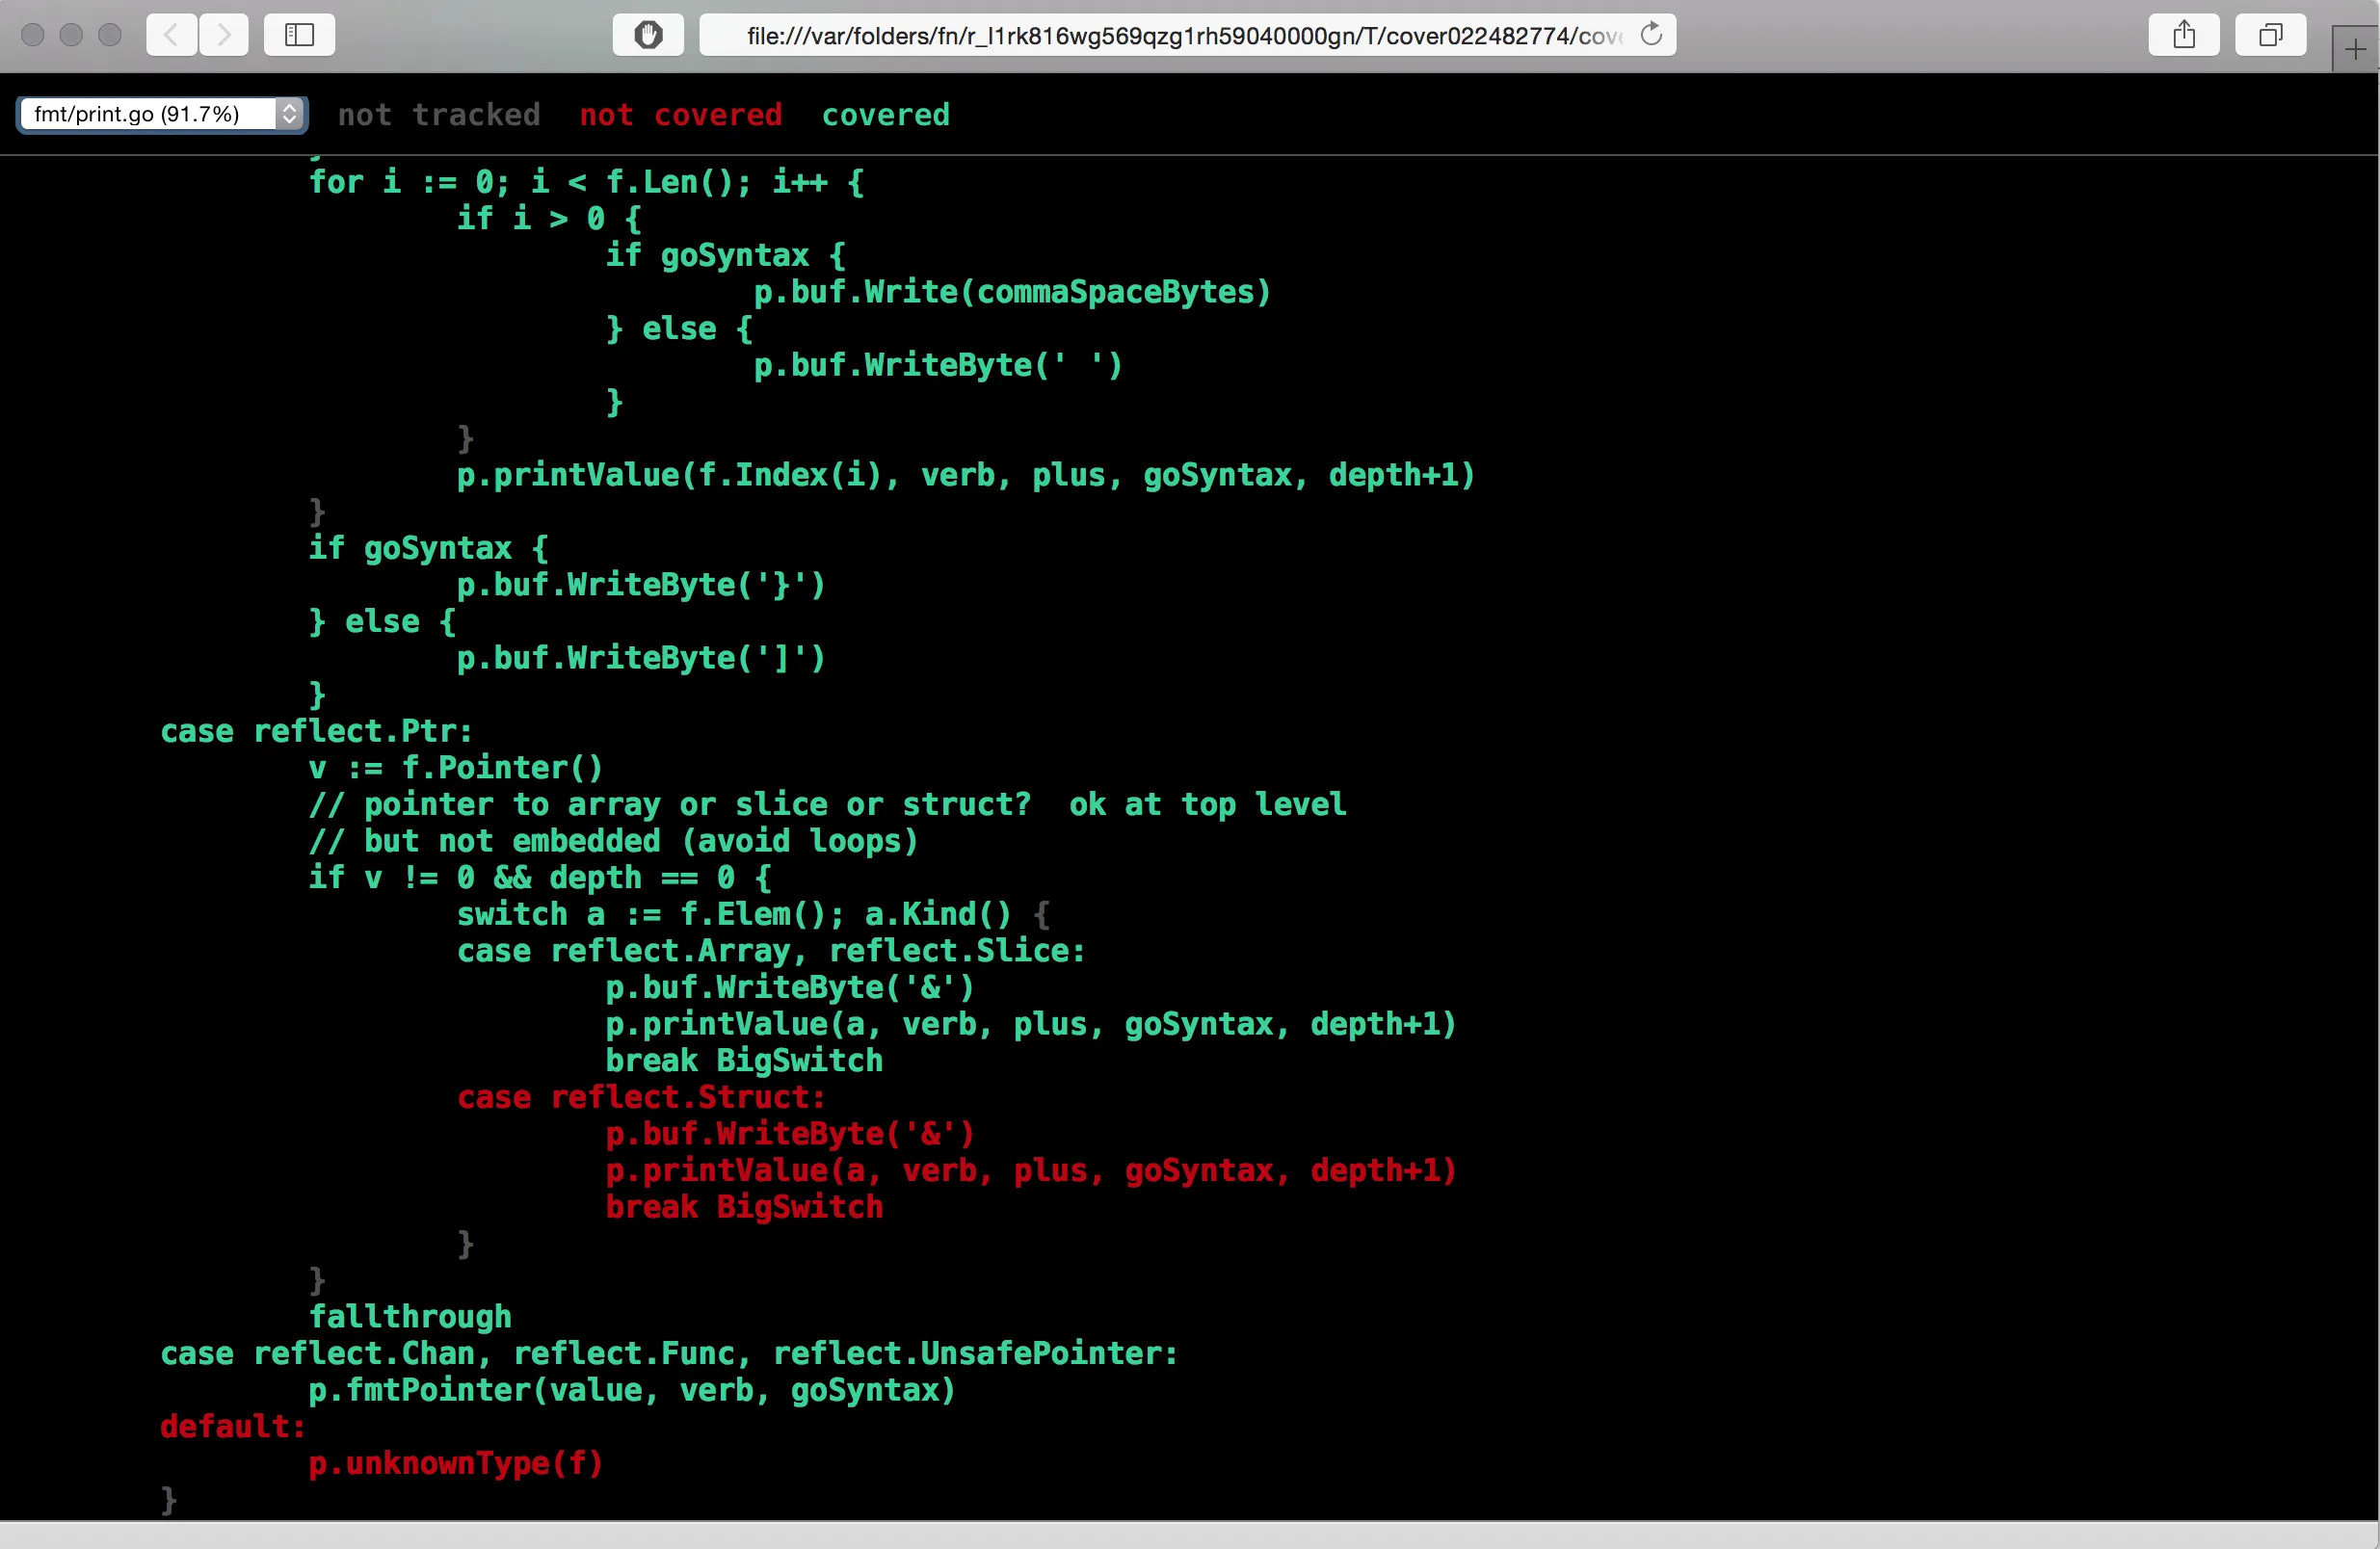
然后只需进入go项目/包文件夹并输入"cover"命令即可。这将在浏览器中打开一个可视化工具,显示当前包中每个文件的已测试和未测试代码。非常实用的命令!强烈推荐使用以查找尚未完全测试的内容!显示的结果是每个文件的覆盖率。从左上角的下拉菜单中,您可以查看所有文件的结果。
使用此命令,还可以检查任何包的覆盖范围,例如:
"cover fmt"
该命令的终端输出为:
ok fmt 0.031s coverage: 91.9% of statements
此外,在您的浏览器中,您将看到该工具以红色显示所有未覆盖测试的代码行:
还可以仅保存HTML覆盖文件而不是在浏览器中打开它。这在测试和覆盖率由Jenkins等CI工具运行的情况下非常有用。这样,您可以从中央服务器提供覆盖文件,并且整个团队将能够查看每个构建的覆盖结果。
- Pavel Nikolov
4
从这里复制代码片段https://coderwall.com/p/rh-v5a/get-coverage-of-golang-test获取Golang测试覆盖率 - Pavel Nikolov
有趣的,我会测试一下。+1 - VonC
太棒了!谢谢分享。最终我转移到了一个测试脚本,因为我想测试程序中的主要包。干杯! - James O'Toole
1如果您想将每个文件的百分比作为列表,可以使用以下命令:
cat cover.out.html | grep '<option value="file' | sed -E 's/.*>(.*) \((.*)%\)<.*/\2 \1/' | sort -rn - Mattias Wadman67
除了上面的好答案之外,我认为以下这三行代码是获得(包括所有软件包)最简单的方法:
go test -v -coverprofile cover.out ./YOUR_CODE_FOLDER/...
go tool cover -html cover.out -o cover.html
open cover.html
有关其他选项,请参见"go tool cover -help"。
- Sharon Katz
3
我遇到了"参数过多"的错误提示。要查看使用信息,请运行命令"go tool cover -help"。将-hmtl标记后面的"="移除即可解决该问题:
go tool cover -html cover.out -o cover.html - sutirtha
1
open cover.html works fine but it generates unwanted listener logs in the same terminal in ubuntu as follows bash Gtk-Message: 00:03:41.903: Failed to load module "canberra-gtk-module" Gtk-Message: 00:03:41.904: Failed to load module "canberra-gtk-module" - Fayaz非常有帮助!你可能想要提到
... 用于递归搜索内部文件夹。 - undefined32
只需运行
go test -cover
go test -cover ./...
go test -coverprofile=coverage.out ./... ; go tool cover -func=coverage.out
或者查看源代码
go test -coverprofile=coverage.out ./... ; go tool cover -html=coverage.out
- Amin Shojaei
3
无法在Windows11上运行。 - Reza Taba
1@RezaTaba,这似乎不是真的,这些命令是跨平台的,你到底有什么问题?(为什么说它不起作用?) - Arsham Arya
我当时不确定问题出在哪里。但是我通过VSCode的命令面板找到了更好的解决方案,这已经集成在其中了。我在这里提供我的解决方案。 - Reza Taba
16
我在网上找不到这样的工具。
实际上...现在(2022年)有一个来自Nikolay Dubina的项目go-cover-treemap-web上有这样的工具:
它不需要上传任何内容(处理仍然在本地进行),但是通过拖放您的覆盖文件,Web UI(使用Go WASM)将运行go-cover-treemap并显示:
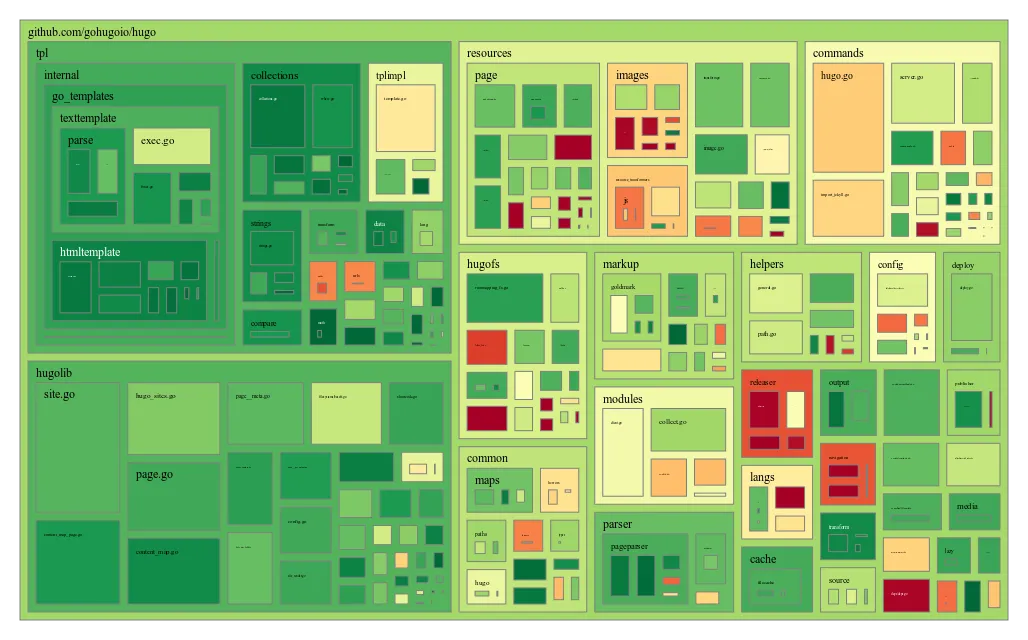
(gocovergage for https://github.com/gohugoio/hugo)
- VonC
16
已经内置在VSCode中
- Ctrl+Shift+P 打开命令面板
- Go: 切换测试覆盖率...
绿色 部分表示已经通过测试,红色 则未通过
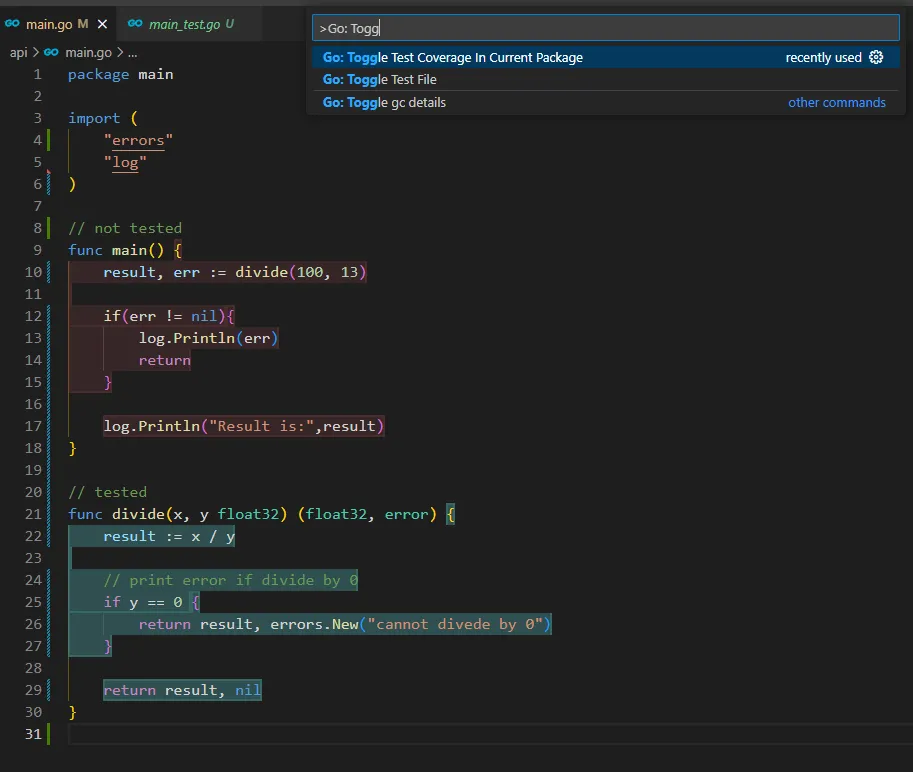
- Reza Taba
1
谢谢!我在想为什么我找不到一个好的自定义解决方案来在VS Code中查看测试覆盖率,原来它已经存在于原生环境中。 - undefined
12
测试覆盖率报告:
a) 运行所有的测试并启用覆盖率 → go test ./... -coverprofile coverage.out
b) 获取单个函数以及总体覆盖率 → go tool cover -func coverage.out
c) 查看测试覆盖的代码行和未覆盖的代码行 → go tool cover -html=coverage.out -o coverage.html。在浏览器中打开生成的 coverage.html 文件,分析详细的覆盖率信息。
- Aman Mann
5
如果你使用的是VSCode,这个功能已经被内置支持了(但默认情况下是禁用的)。
只需要开启 “test on save + coverage reporting” 功能即可。 https://github.com/microsoft/vscode-go/wiki/On-Save-features 它甚至可以在编辑器中显示哪些行没有被覆盖,非常方便。
只需要开启 “test on save + coverage reporting” 功能即可。 https://github.com/microsoft/vscode-go/wiki/On-Save-features 它甚至可以在编辑器中显示哪些行没有被覆盖,非常方便。
- Tom Yeoman
5
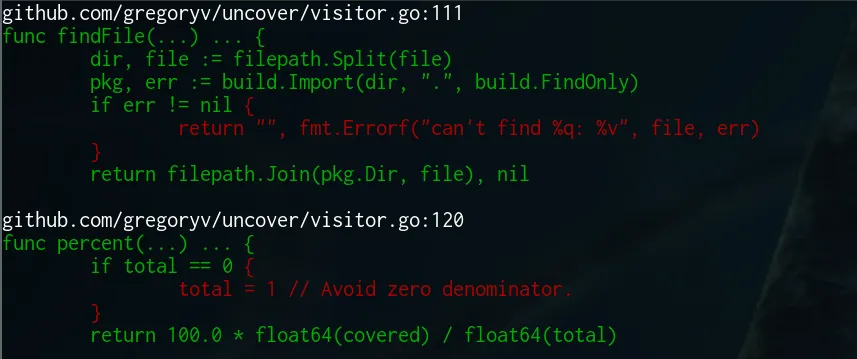
如果您想直接在终端中查看函数的未覆盖行,我为此目的重新编写了覆盖工具。它可在https://github.com/gregoryv/uncover上获得。
用法
go get -u github.com/gregoryv/uncover/...
go test -coverprofile /tmp/c.out
uncover /tmp/c.out
屏幕截图
- dot7
5
$ go tool
6a
6c
6g
6l
addr2line
api
cgo
cov
dist
ebnflint
fix
gotype
nm
objdump
pack
pprof
prof
vet
yacc
$ go tool cov -h
usage: cov [-lsv] [-g substring] [-m minlines] [6.out args...]
-g specifies pattern of interesting functions or files
go tool cov: exit status 1
$
我没有使用过它,这就是我所知道的全部。
- zzzz
4
你需要手动安装吗?在我的本地 Go 安装中(Go 版本为 go1),它并不存在。 - oers
我相信它是通过./all.bash构建的。目前我无法验证,因为我有一个CL待处理,但我在~/go/pkg/tool/linux_amd64中看到的cov二进制时间戳与昨天我的最后一次Go构建匹配。 - zzzz
是的,请运行./all.bash,你就会得到它。感谢帮助,jnml! - Georgi Atsev
我在我的x86机器上运行它时遇到了一些问题。我尝试按照这个帖子中提到的更改main.c:http://groups.google.com/group/golang-dev/browse_thread/thread/59c18314b18cbf9e
但它在另一个位置生成了运行时错误。我将在64位机器上尝试它。 - Georgi Atsev
网页内容由stack overflow 提供, 点击上面的可以查看英文原文,
原文链接
原文链接