图表区域背景颜色Chart.js

53
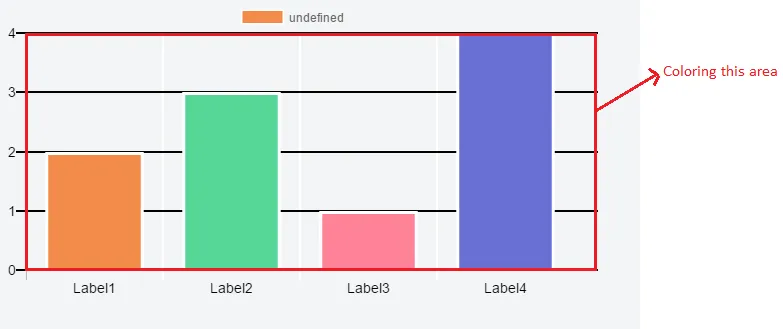
我有一个关于Chart.js的问题,我想像上面的图片一样对图表区域进行着色。 enter image description here 我尝试从Chart.js文档中查找配置,但没有匹配项。 是否可能更改图表区域的背景颜色? 如果可能,有人可以帮助我吗?
Html
<canvas id="barChart" width="600" height="300"></canvas>

JavaScript

var ctx = document.getElementById("barChart");
var barChart = new Chart(ctx,{
  type: 'bar',
  data: {
    labels:["Label1","Label2","Label3","Label4"],
    borderColor : "#fffff",
    datasets: [
      {
        data: ["2","3","1","4"],
        borderColor : "#fff",
        borderWidth : "3",
        hoverBorderColor : "#000",
        backgroundColor: [
          "#f38b4a",
          "#56d798",
          "#ff8397",
          "#6970d5" 
        ],
        hoverBackgroundColor: [
          "#f38b4a",
          "#56d798",
          "#ff8397",
          "#6970d5"
        ]
      }]
  },
  options: {
    scales: {
      yAxes: [{
        ticks:{
          min : 0,
          stepSize : 1,
          fontColor : "#000",
          fontSize : 14
        },
        gridLines:{
          color: "#000",
          lineWidth:2,
          zeroLineColor :"#000",
          zeroLineWidth : 2
        },
        stacked: true
      }],
      xAxes: [{
        ticks:{
          fontColor : "#000",
          fontSize : 14
        },
        gridLines:{
          color: "#fff",
          lineWidth:2
        }
      }]
    },
    responsive:false
  }
});

这是我的当前代码 jsFiddle ,大家可以尝试找到解决方案。感谢您的帮助。
5个回答

78

没有内置的方法来更改背景颜色,但是您可以使用 CSS。JSFiddle

ctx.style.backgroundColor = 'rgba(255,0,0,255)';

编辑

如果您想填充图表的确切区域而不是整个 div,您可以编写自己的 chart.js 插件。在 JSFiddle 上尝试一下。

        Chart.pluginService.register({
            beforeDraw: function (chart, easing) {
                if (chart.config.options.chartArea && chart.config.options.chartArea.backgroundColor) {
                    var ctx = chart.chart.ctx;
                    var chartArea = chart.chartArea;

                    ctx.save();
                    ctx.fillStyle = chart.config.options.chartArea.backgroundColor;
                    ctx.fillRect(chartArea.left, chartArea.top, chartArea.right - chartArea.left, chartArea.bottom - chartArea.top);
                    ctx.restore();
                }
            }
        });

        var config = {
  type: 'bar',
  data: {
    labels:["Label1","Label2","Label3","Label4"],
    borderColor : "#fffff",
    datasets: [
      {
        data: ["2","3","1","4"],
        borderColor : "#fff",
        borderWidth : "3",
        hoverBorderColor : "#000",
        backgroundColor: [
          "#f38b4a",
          "#56d798",
          "#ff8397",
          "#6970d5" 
        ],
        hoverBackgroundColor: [
          "#f38b4a",
          "#56d798",
          "#ff8397",
          "#6970d5"
        ]
      }]
  },
  options: {
    scales: {
      yAxes: [{
        ticks:{
          min : 0,
          stepSize : 1,
          fontColor : "#000",
          fontSize : 14
        },
        gridLines:{
          color: "#000",
          lineWidth:2,
          zeroLineColor :"#000",
          zeroLineWidth : 2
        },
        stacked: true
      }],
      xAxes: [{
        ticks:{
          fontColor : "#000",
          fontSize : 14
        },
        gridLines:{
          color: "#fff",
          lineWidth:2
        }
      }]
    },
    responsive:false,
    chartArea: {
        backgroundColor: 'rgba(251, 85, 85, 0.4)'
    }
  }
};

        var ctx = document.getElementById("barChart").getContext("2d");
        new Chart(ctx, config);

谢谢您的回答,但我只需要在图表区域内进行着色,就像我问题中的图片一样,而不是标签区域。 - Pajar Fathurrahman
但是为什么y轴不从0开始呢? - Pajar Fathurrahman
1
@PajarFathurrahman。抱歉,这是一个打字错误。这是最终的JSFiddle - user6586783
可以为雷达图这样做吗?不是着色整个矩形,而是只着色雷达部分? - PolGraphic
我有一个相关的问题:https://stackoverflow.com/questions/51358701/chartjs-set-background-color-of-the-space-between-ticks。请帮我提供建议。谢谢。 - Pascut
问题在于当您保存图像时,图像没有任何背景颜色。它看起来是黑色/深灰色的。 - Spartan 117

11

画布背景默认是透明的,和任何元素一样,所以你只需要在你的画布中定义 background-color,例如,在你的情况下,你需要这个 CSS:

JSFiddle

canvas#barChart {
  background-color: #f00;
}

或HTML内联,以澄清这个想法:

<canvas id="barChart" width="600" height="300" style="background-color: #f00;"></canvas>

1
这个在屏幕上显示是正确的,但是当右键单击画布并将其复制或保存为图像时,图像的背景仍未设置(透明)。 - Yan Yang

7
这适用于最新版本的Chart.js。
    const custom_canvas_background_color = {
      id: 'custom_canvas_background_color',
      beforeDraw: (chart, args, options) => {
        const {
          ctx,
          chartArea: { top, right, bottom, left, width, height },
          scales: { x, y },
        } = chart;
        ctx.save();
        ctx.globalCompositeOperation = 'destination-over';
        ctx.fillStyle = '#E5E5E5';
        ctx.fillRect(left, top, width, height);
        ctx.restore();
      },
    };

然后添加为插件

 plugins: [custom_canvas_background_color]

1
如果您想为整个画布(而不仅仅是绘图区域)设置颜色,可以按照以下方式进行操作:
Chart.pluginService.register({
  beforeDraw: ({ config: { options }, ctx }) => {
    if (options.chartArea?.backgroundColor) {
      ctx.save();
      ctx.fillStyle = options.chartArea.backgroundColor;
      ctx.fillRect(0, 0, ctx.canvas.width, ctx.canvas.height);
      ctx.restore();
    }
  }
});

const chart = new Chart(document.getElementById('chart'), {
  options: {
    chartArea: {
      backgroundColor: 'rgba(255, 255, 255, 1)'
    }
  }
});

当使用 chart.toBase64Image() 时,将应用此项到 PNG 上。


0

你可以通过实现这个Chartjs插件plugin / example来实现这一点。该插件允许你增强你的图表。例如,放大或平移到你的图表上。还可以更改背景颜色。使用setBackgroundColor(color); //更新图表的背景颜色


网页内容由stack overflow 提供, 点击上面的
可以查看英文原文,
原文链接