我正在寻找一种方法来微调六边形图中单个单元格的颜色。
我尝试使用
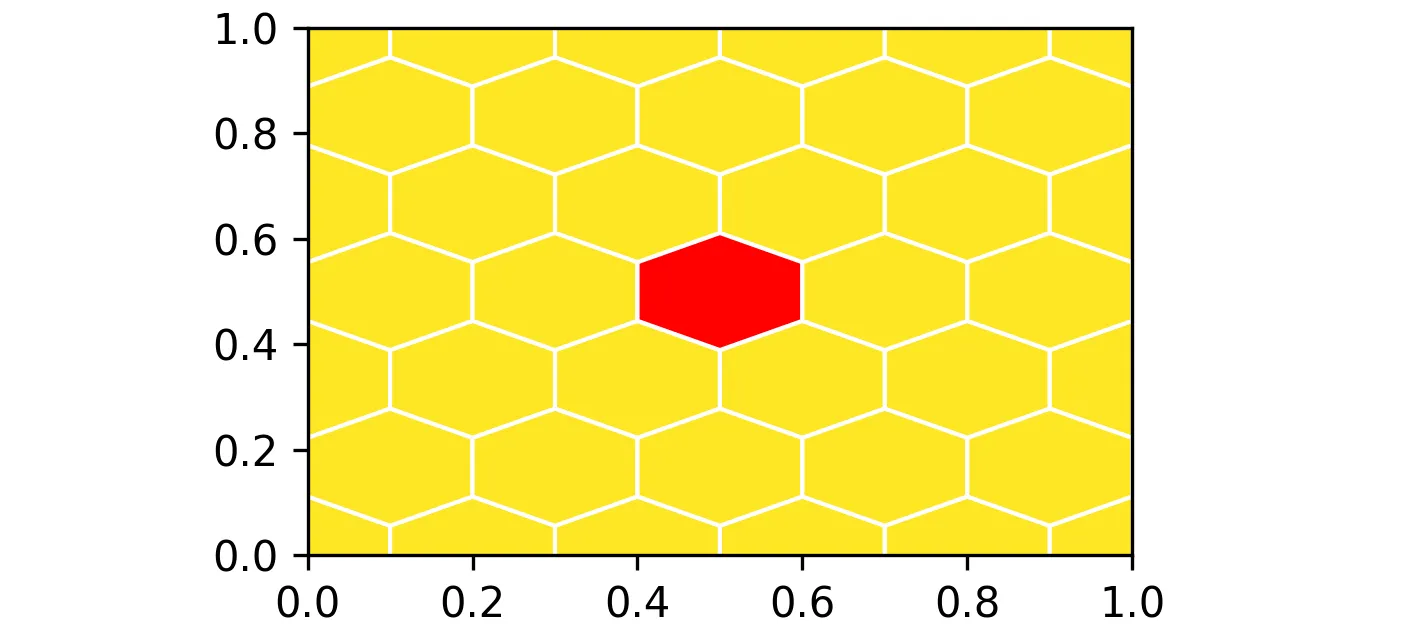
例如:这应该会在中心产生一个红色的六边形图。
我尝试使用
PolyCollection中的set_facecolors方法来改变单个单元格的颜色,但似乎无效。例如:这应该会在中心产生一个红色的六边形图。
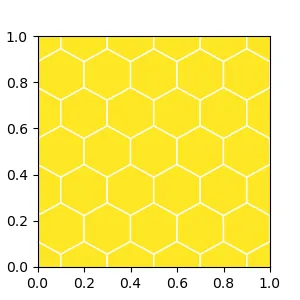
import numpy as np
import matplotlib.pyplot as plt

x = y = np.linspace(0.,1.,10)
pts=np.vstack(np.meshgrid(x,y,indexing='ij')).reshape(2,-1).T
z = np.zeros_like(pts[:,0])

fig, ax = plt.subplots(figsize=(3, 3))
hb = ax.hexbin(pts[:,0],pts[:,1], C=z, gridsize=(5,3), vmin=-1., edgecolors='white')
ax.set_xlim([0,1])
ax.set_ylim([0,1])

ax.figure.canvas.draw()
fcolors = hb.get_facecolors()
fcolors[31] = [1., 0., 0., 1.]
hb.set_facecolors(fcolors)

plt.show()