如何将RGB图像转换为灰度图像但保留一种颜色?

39

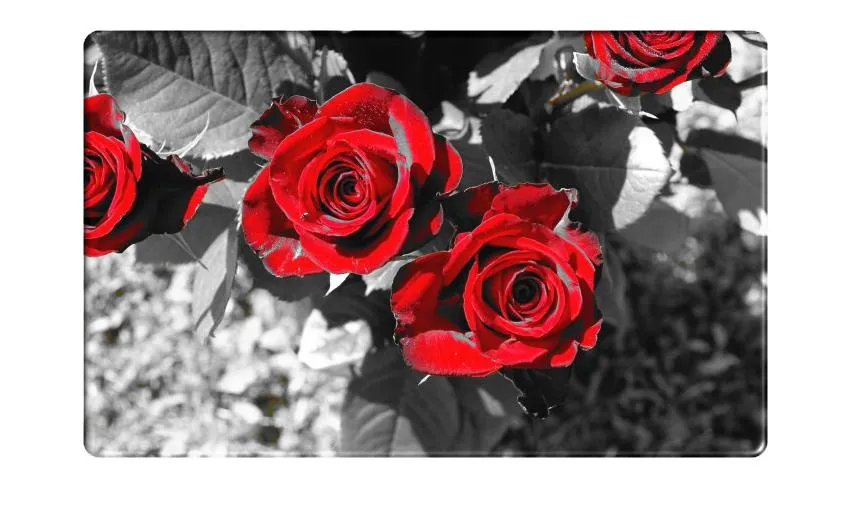
我正在尝试创建类似于《罪恶之城》或其他电影中的效果,即从图像中移除除一种颜色外的所有颜色。

我有一张RGB图像,我想将其转换为灰度图像,但我想保留一种颜色。
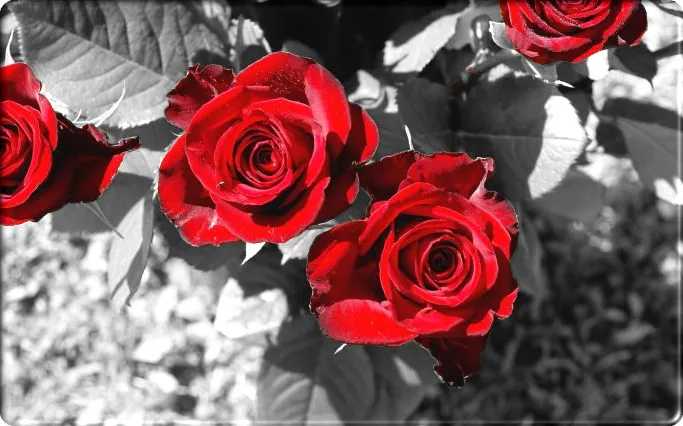
这是我的图片:

alt text

我想保留红色。其余部分应该是灰度的。

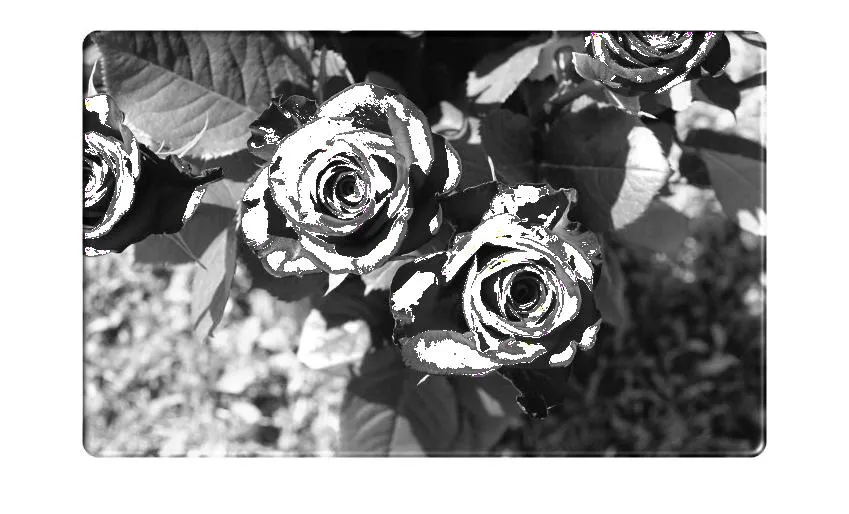
这是到目前为止我的代码输出的结果(您可以看到区域是正确的,但我不知道它们为什么是白色而不是红色):

alt text

这是到目前为止我的代码:

filename = 'roses.jpg';

[cdata,map] = imread( filename );
% convert to RGB if it is indexed image
if ~isempty( map ) 
   cdata = idx2rgb( cdata, map ); 
end

%imtool('roses.jpg');

imWidth = 685;
imHeight = 428;

% RGB ranges of a color we want to keep
redRange = [140 255];
greenRange = [0 40];
blueRange = [0 40];

% RGB values we don't want to convert to grayscale
redToKeep = zeros(imHeight, imWidth);
greenToKeep = zeros(imHeight, imWidth);
blueToKeep = zeros(imHeight, imWidth);

for x=1:imWidth

    for y=1:imHeight

        red = cdata( y, x, 1 );
        green = cdata( y, x, 2 );
        blue = cdata( y, x, 3 );

        if (red >= redRange(1) && red <= redRange(2) && green >= greenRange(1) && green <= greenRange(2) && blue >= blueRange(1) && blue <= blueRange(2))
            redToKeep( y, x ) = red;
            greenToKeep( y, x ) = green;
            blueToKeep( y, x ) = blue;
        else
            redToKeep( y, x ) = 999;
            greenToKeep( y, x ) = 999;
            blueToKeep( y, x ) = 999;
        end

    end 

end 

im = rgb2gray(cdata);
[X, map] = gray2ind(im);
im = ind2rgb(X, map);

for x=1:imWidth

    for y=1:imHeight

        if (redToKeep( y, x ) < 999)
            im( y, x, 1 ) = 240;
        end
        if (greenToKeep( y, x ) < 999)
            im( y, x, 2 ) = greenToKeep( y, x );
        end
        if (blueToKeep( y, x ) < 999)
            im( y, x, 3 ) = blueToKeep( y, x );
        end

    end 

end 

imshow(im);

似乎Matlab提供了一个解决方案,但看到这个代码高尔夫比赛会很有趣... - gary
3个回答

91

为了更轻松地选择颜色并大幅提高结果图像的质量,可以将图像转换到不同的颜色空间。其中,HSV 颜色空间 以色相(颜色)、饱和度(颜色的数量)和明度(颜色的亮度)来定义像素颜色。

例如,您可以使用函数rgb2hsv将 RGB 形式的图像转换成 HSV 颜色空间,找出具有您想要定义为“非红色”的颜色范围(例如 20 到 340 度)的色相值,将这些像素的饱和度设置为 0(使它们变成灰度),然后使用函数 hsv2rgb 将图像再次转换回 RGB 颜色空间:

cdata = imread('EcyOd.jpg');       % Load image
hsvImage = rgb2hsv(cdata);         % Convert the image to HSV space
hPlane = 360.*hsvImage(:, :, 1);   % Get the hue plane scaled from 0 to 360
sPlane = hsvImage(:, :, 2);        % Get the saturation plane
nonRedIndex = (hPlane > 20) & ...  % Select "non-red" pixels
              (hPlane < 340);
sPlane(nonRedIndex) = 0;           % Set the selected pixel saturations to 0
hsvImage(:, :, 2) = sPlane;        % Update the saturation plane
rgbImage = hsv2rgb(hsvImage);      % Convert the image back to RGB space

以下是生成的图像:

alt text

zellus的解决方案相比,注意到您可以轻松地保持花朵上的淡粉色调。还要注意,茎和地面上的棕色调也消失了。

关于基于颜色属性从图像中选择对象的一个很棒的例子,您可以查看Steve Eddins的博客文章The Two Amigos,其中描述了MathWorks的Brett Shoelson提取图像中一个“amigo”的解决方案。


关于选择颜色范围的说明...

您可以做的另一件事是,可以帮助您选择颜色范围的内容是查看HSV图像中的像素中存在的色调(即上面代码中的hPlane)的直方图。这里有一个使用函数histc(如果可用,则建议使用histcounts)和bar的例子:

binEdges = 0:360;    % Edges of histogram bins
hFigure = figure();  % New figure

% Bin pixel hues and plot histogram:
if verLessThan('matlab', '8.4')
  N = histc(hPlane(:), binEdges);  % Use histc in older versions
  hBar = bar(binEdges(1:end-1), N(1:end-1), 'histc');
else
  N = histcounts(hPlane(:), binEdges);
  hBar = bar(binEdges(1:end-1), N, 'histc');
end

set(hBar, 'CData', 1:360, ...            % Change the color of the bars using
          'CDataMapping', 'direct', ...  %   indexed color mapping (360 colors)
          'EdgeColor', 'none');          %   and remove edge coloring
colormap(hsv(360));                      % Change to an HSV color map with 360 points
axis([0 360 0 max(N)]);                  % Change the axes limits
set(gca, 'Color', 'k');                  % Change the axes background color
set(hFigure, 'Pos', [50 400 560 200]);   % Change the figure size
xlabel('HSV hue (in degrees)');          % Add an x label
ylabel('Bin counts');                    % Add a y label

以下是生成的像素颜色直方图:

alt text

请注意原始图像主要包含红色、绿色和黄色像素(还有少量橙色像素),几乎没有青色、蓝色、靛色或品红色像素。另外,请注意我上面选择的范围(20至340度)很好地排除了两端的两个大红色聚类之外的大部分内容。


谢谢。我会尝试一下。同时,我已经更新了我的问题。你能看一下吗? :) - Richard Knop
4
感谢您的解决方案,我给您点个赞。结果和代码都非常优秀。 - zellus

19
figure
pic = imread('EcyOd.jpg');

for mm = 1:size(pic,1)
    for nn = 1:size(pic,2)
        if pic(mm,nn,1) < 80 || pic(mm,nn,2) > 80 || pic(mm,nn,3) > 100
            gsc = 0.3*pic(mm,nn,1) + 0.59*pic(mm,nn,2) + 0.11*pic(mm,nn,3);
            pic(mm,nn,:) = [gsc gsc gsc];
        end
    end
end
imshow(pic)

alt text


谢谢,这样做起来容易多了。不过你是怎么得到那些系数(0.3、0.59、0.11)的呢?我不太明白。 - Richard Knop
3
这是RGB2GRAY使用的公式,如文档中所列。 - gnovice
@Richard Knop:http://www.mathworks.com/help/toolbox/images/ref/rgb2gray.html 向下滚动一点,直到你到达段落“算法”。但是网上还有其他的资料。 - zellus
1
回复:(0.3,0.59,0.11)人类视觉系统对绿色的敏感度比红色高,对红色的敏感度比蓝色高。这些数字是对可见光谱范围内HVS响应的近似值。[http://en.wikipedia.org/wiki/Spectral_sensitivity] - David Poole
我在第一行的语句中遇到了无效的语法错误,具体是 "="。使用的是Python 3.10版本。 - Parrotmaster
这是MATLAB代码,你可以将算法转换为Python。 - zellus

2
我不太了解matlab的工作原理,所以无法对代码进行评论,但也许这可以帮助一些人了解RGB颜色是如何工作的。
使用RGB颜色时,可以通过确保R、G和B的值相同来制作灰度。因此,基本上你想做的就是检测像素是否为红色,如果不是,只需使R、G和B相同(你可以使用三者的平均值得到一个简单的结果)。
更难的部分是如何检测像素是否真正为红色,你不能仅仅检查像素在R值上是否高,因为它仍然可能是另一种颜色,而低R值可能只意味着较暗的红色。
因此,你可以像这样做:(我没有matlab,所以假设语法):
red = cdata(y, x, 1); green = cdata(y, x, 2); blue = cdata(y, x, 3);
if (red < (blue * 1.4) || red < (green * 1.4)) { avg = (red + green + blue) / 3; cdata(y, x, 1) = avg; cdata(y, x, 2) = avg; cdata(y, x, 3) = avg; }
可能有更好的方法来检测红色并获得平均灰度,但这是一个开始 ;)

谢谢。我已经稍微修改了我的代码,现在已经有一些输出了,但是应该是红色的区域却变成了白色。请查看我的更新问题。 - Richard Knop
你的颜色是白色的,因为你删除了想要保留的像素的绿色和蓝色原始值。这就是为什么在示例中它只修改要变成灰色的像素的矩阵,而将其余部分保持不变。 - Doggett
我在没有注意到你的帖子的情况下实现了你的算法。希望你不介意。 - zellus
@Zellus 没有,我看到我对matlab完全不了解,所以我的例子比必要的长度长一点;) - Doggett

网页内容由stack overflow 提供, 点击上面的
可以查看英文原文,
原文链接