我正在尝试使用 Matplotlib 绘制一个带有偏移文本刻度的三维图形。为此,我使用了 ImportanceOfBeingErnest 的自定义坐标轴主要格式化程序,以便将此刻度以 LaTeX 格式表示:
import matplotlib
import matplotlib.pyplot as plt
import matplotlib.ticker as ticker
from mpl_toolkits.mplot3d import Axes3D
from matplotlib import cm
import numpy as np

class OOMFormatter(matplotlib.ticker.ScalarFormatter):
    def __init__(self, order=0, fformat="%1.1f", offset=True, mathText=True):
        self.oom = order
        self.fformat = fformat
        matplotlib.ticker.ScalarFormatter.__init__(self,useOffset=offset,useMathText=mathText)
    def _set_order_of_magnitude(self):
        self.orderOfMagnitude = self.oom
    def _set_format(self, vmin=None, vmax=None):
        self.format = self.fformat
        if self._useMathText:
             self.format = r'$\mathdefault{%s}$' % self.format


x = np.linspace(0, 22, 23)
y = np.linspace(-10, 10, 21)
X, Y = np.meshgrid(x, y)
V = -(np.cos(X/10)*np.cos(Y/10))**2*1e-4

fig, ax = plt.subplots(subplot_kw={"projection": "3d"})
surf = ax.plot_surface(X, Y, V, cmap=cm.jet,
                       linewidth=0, antialiased=False)
ax.zaxis.set_major_formatter(OOMFormatter(int('{:.2e}'.format(np.min(V)).split('e')[1]), mathText=True))
ax.zaxis.set_rotate_label(False)
ax.set_xlabel(r'$x$ (cm)', size=20, labelpad=10)
ax.set_ylabel(r'$y$ (cm)', size=20, labelpad=10)
ax.set_zlabel(r'$A_z$', size=20, labelpad=10)
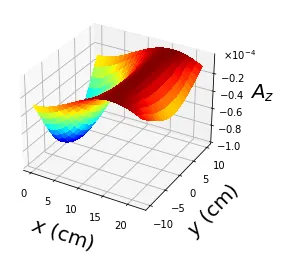
这导致出现以下图像:
 请注意,比例尺(z轴偏移文本,x 10^{-4})被旋转了90度。为了解决这个问题,我尝试访问偏移文本的元素并将其旋转为0:
ax.zaxis.get_offset_text().set_rotation(0)
ax.zaxis.get_offset_text().get_rotation()
>>> 0
然而这没有任何用,因为偏移的文本并没有旋转一英寸。之后我尝试在运行绘图函数时打印文本对象:
surf = ax.plot_surface(X, Y, V, cmap=cm.jet,
                       linewidth=0, antialiased=False)
.
.
.
print(ax.zaxis.get_offset_text())
>>>Text(1, 0, '')
这让我想到,也许偏移文本并没有存储在这个变量中。但是,当我运行相同的命令而不调用绘图函数时,它返回了我预期的结果。
print(ax.zaxis.get_offset_text())
>>>Text(-0.1039369506424546, 0.050310729257045626, '$\\times\\mathdefault{10^{−4}}\\mathdefault{}$')
我做错了什么?