Matplotlib(Python)中处理子图比例

3

您好,我正在尝试使用matplotlib创建下面的子图。

Subplots

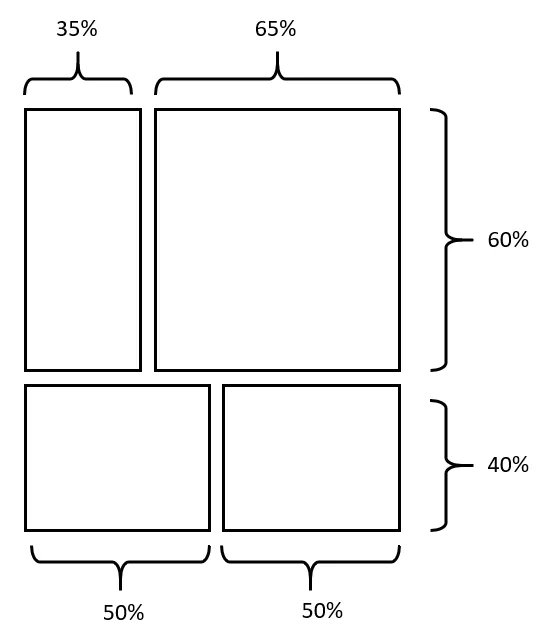
以下是我的代码,但我似乎无法使用参数正确地配置图表。希望能得到任何有关此问题的帮助。欢迎使用其他Python绘图工具来帮助我拼接这四张图。

非常感谢!

gs1 = fig9.add_gridspec(nrows=8, ncols=8, top=0.6, bottom=0.1,left = 0, right = 0.65,
                        wspace=0.05, hspace=0.05)
# f9_ax1 = fig9.add_subplot(gs1[:-1, :])
ax2 = fig9.add_subplot(gs1[:1, :1])
ax3 = fig9.add_subplot(gs1[:1, 1:])

gs2 = fig9.add_gridspec(nrows=4, ncols=4, top=1.2, bottom=0.4, left = 0, right = 0.5,
                        wspace=0.05, hspace=0.05)
ax4 = fig9.add_subplot(gs1[1: , :1])
ax5 = fig9.add_subplot(gs1[1:, 1:])
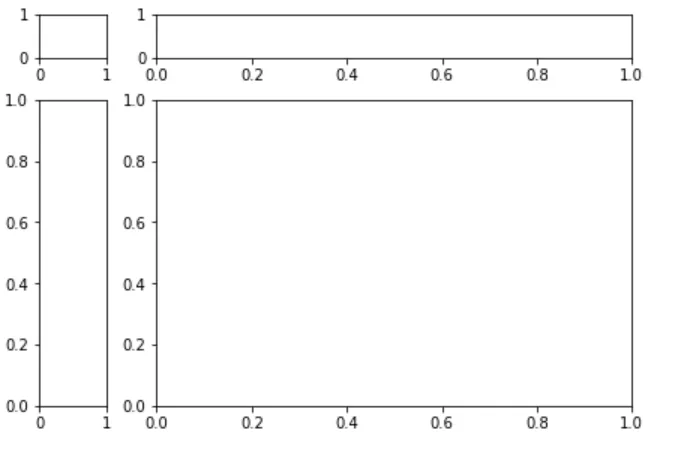
以上代码会得到下图所示的结果: enter image description here
2个回答

3
你可以将图形分成例如 20 × 20 的网格,这意味着一个单元格占据图形的 5% × 5%。将比例缩放为 35/65 -> 7/1340/60 -> 8/1250/50 -> 10/10,应用于此网格得到:
import matplotlib.pyplot as plt

fig = plt.figure(constrained_layout=True)
gs1 = fig.add_gridspec(nrows=20, ncols=20)
 
ax1 = fig.add_subplot(gs1[0:12, 0:7])     # top left     (size: 12x7  - 60x35)
ax2 = fig.add_subplot(gs1[0:12, 7:20])    # top right    (size: 12x13 - 60x65)
ax3 = fig.add_subplot(gs1[12:20, 0:10])   # bottom left  (size: 8x10  - 40x50)
ax4 = fig.add_subplot(gs1[12:20, 10:20])  # bottom right (size: 8x10  - 40x50)

网格规范

请注意constrained_layout关键字,将其设置为True会缩小子图以使所有轴标签可见,但这可能会不期而遇地改变它们的长宽比例。如果将其设置为False,则可以更好地保留比例。然而,目前Constrained Layout是实验性质的,可能会被修改或删除。

有关更多信息,请参见文档


3
创建两个独立的网格布局,你可以将它们的height_ratios都设置为(6, 4),但是根据需要为它们分别赋予不同的width_ratios
例如:
import matplotlib.pyplot as plt

fig = plt.figure()

gs1 = fig.add_gridspec(nrows=2, ncols=2, hspace=0.05, wspace=0.05,
                       height_ratios=(6, 4), width_ratios=(35, 65))
gs2 = fig.add_gridspec(nrows=2, ncols=2, hspace=0.05, wspace=0.05, 
                       height_ratios=(6, 4), width_ratios=(1, 1))

ax1 = fig.add_subplot(gs1[0, 0])
ax2 = fig.add_subplot(gs1[0, 1])
ax3 = fig.add_subplot(gs2[1, 0])
ax4 = fig.add_subplot(gs2[1, 1])

plt.show()

enter image description here


网页内容由stack overflow 提供, 点击上面的
可以查看英文原文,
原文链接