基于http://tidytextmining.com/sentiment.html#the-sentiments-dataset,我正在尝试对一个tibble进行情感分析。
设置tibble:
创建:
生成情感:
创建:
我该如何将它们转换为一系列图表,其中每个图表都是一个特定的URL,类似于?
设置tibble:
url <- c( "t1" , "t2")
word <- c( "abnormal" , "good")
n <- c( 1 , 1)
score <- c(1 , 2)
res <- as_tibble(data.frame("url"=url , "word"=word, "n"=n , "score"=score , stringsAsFactors = F))
res
创建:
# A tibble: 2 x 4
    url     word     n score
  <chr>    <chr> <dbl> <dbl>
1    t1 abnormal     1     1
2    t2     good     1     2
生成情感:
joined_sentiments <- res %>% inner_join(get_sentiments("bing"))
joined_sentiments
创建:
# A tibble: 2 x 5
    url     word     n score sentiment
  <chr>    <chr> <dbl> <dbl>     <chr>
1    t1 abnormal     1     1  negative
2    t2     good     1     2  positive
我该如何将它们转换为一系列图表,其中每个图表都是一个特定的URL,类似于?
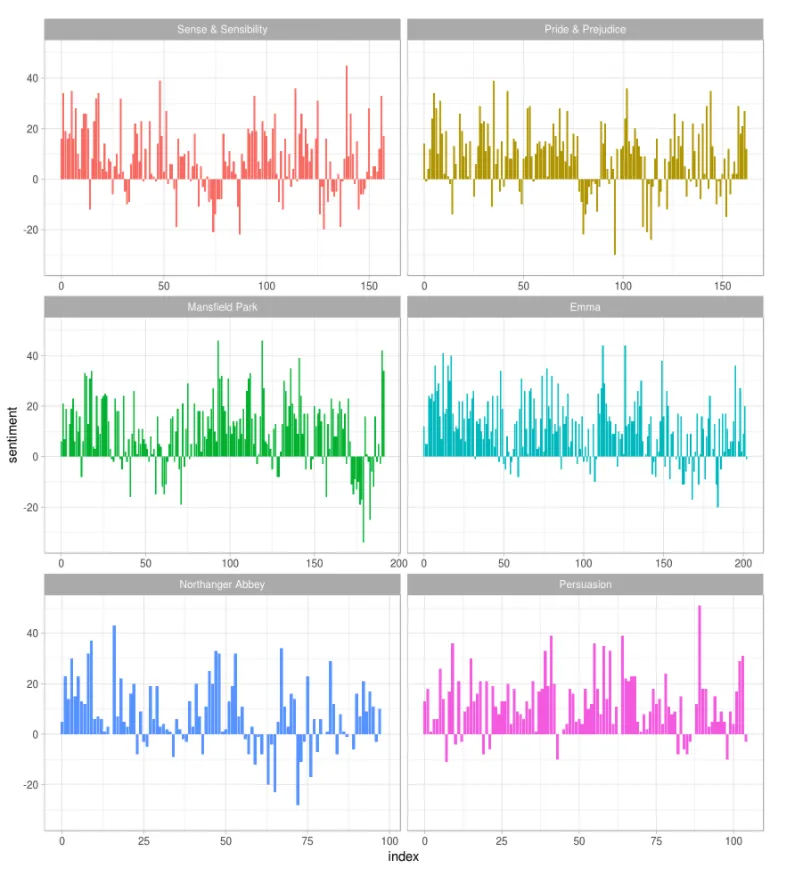
源代码 http://tidytextmining.com/sentiment.html#the-sentiments-dataset
由于没有行号,我正在尝试:
joined_sentiments %>%
  count(url, index=n, sentiment) %>%
  spread(sentiment, n, fill = 0) %>%
  mutate(sentiment = positive - negative)
返回错误:
joined_sentiments %>%
+   count(url, index=n, sentiment) %>%
+   spread(sentiment, n, fill = 0) %>%
+   mutate(sentiment = positive - negative)
Error: `var` must evaluate to a single number or a column name, not a double vector
In addition: Warning message:
In if (!is.finite(x)) return(FALSE) :
  the condition has length > 1 and only the first element will be used