闪亮:动态调整绘图的高度

4
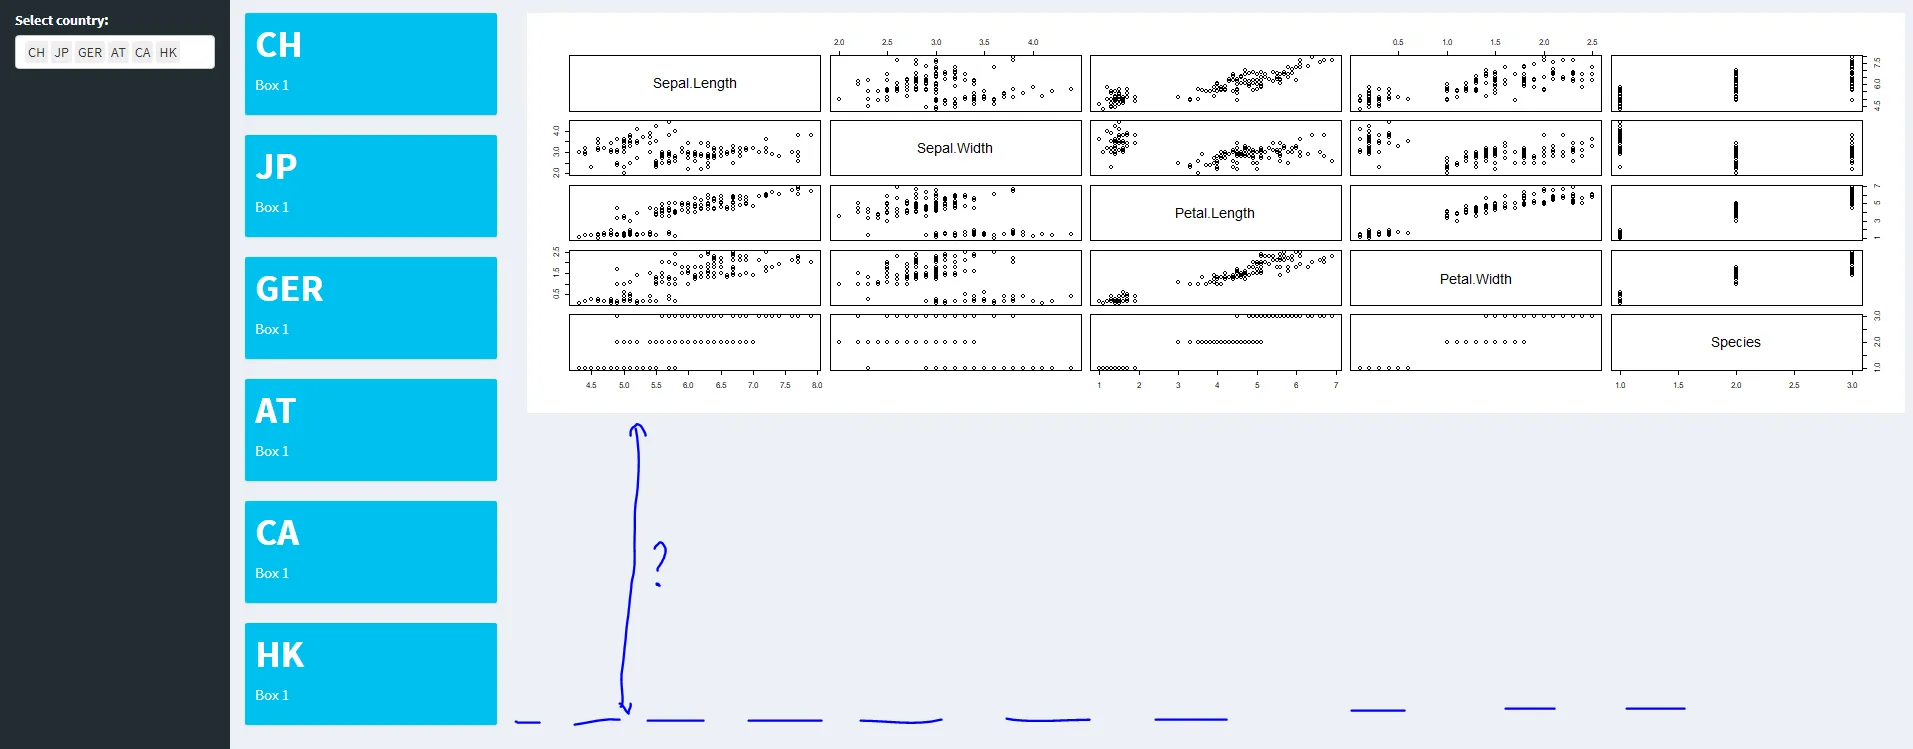
问题: 在下面的Shiny应用程序中,用户可以根据选择输入添加在valueboxes中呈现的信息。如果用户选择了所有可能的选项,则UI看起来如截图所示。 问题: 是否有可能使绘图(与valueboxes在同一行)调整高度(因此绘图的底部与最后一个valuebox的底部对齐)?

enter image description here

library(shiny)
library(shinydashboard)

ui <- dashboardPage(
  dashboardHeader(),
  
  dashboardSidebar(
    selectizeInput(
      inputId = "select",
      label = "Select country:",
      choices = c("CH", "JP", "GER", "AT", "CA", "HK"),
      multiple = TRUE)
  ),
  
  dashboardBody(
    fluidRow(column(2, uiOutput("ui1")),
             column(10, plotOutput("some_plot"))))#,
                # column(4, uiOutput("ui2")),
                # column(4, uiOutput("ui3")))
)

server <- function(input, output) {
  
  output$ui1 <- renderUI({
    req(input$select)
    
    lapply(seq_along(input$select), function(i) {
      fluidRow(
        valueBox(value = input$select[i],
                 subtitle = "Box 1",
                 width = 12)
      )
    })
  })
  
  output$some_plot <- renderPlot(
    plot(iris)
  )
}

shinyApp(ui = ui, server = server)

高度由 plotOutput(height = "400px") 控制(这是默认值),如果将其更改为 height = "100%",会发生什么? - Nate
顺便说一句,漂亮的reprex :) - Nate
2个回答

2

您可以在renderPlot中调整高度。我已将最小值设置为3个价值框的高度。因此,当您添加3个价值框后,它开始增加高度。您可以根据需要进行修改。请尝试下面的代码。

  library(shiny)
  library(shinydashboard)
  
  ui <- dashboardPage(
    dashboardHeader(),
    
    dashboardSidebar(
      selectizeInput(
        inputId = "select",
        label = "Select country:",
        choices = c("CH", "JP", "GER", "AT", "CA", "HK"),
        multiple = TRUE)
    ),
    
    dashboardBody(
      fluidRow(column(2, uiOutput("ui1")),
               column(10, plotOutput("some_plot"))))#,
    
    # column(4, uiOutput("ui2")),
    # column(4, uiOutput("ui3")))
  )
  
  server <- function(input, output) {
    plotht <- reactiveVal(360)
    observe({
      req(input$select)
      nvbox <- length(input$select)
      if (nvbox > 3) {
        plotheight <- 360 + (nvbox-3)*120
      }else plotheight <- 360
      plotht(plotheight)
    })
    
    output$ui1 <- renderUI({
      req(input$select)
      
      lapply(seq_along(input$select), function(i) {
        fluidRow(
          valueBox(value = input$select[i],
                   subtitle = "Box 1",
                   width = 12)
        )
      })
    })
    
    observe({
      output$some_plot <- renderPlot({
        plot(iris)
      }, height=plotht())
    })
 
    
  }
  
  shinyApp(ui = ui, server = server)

0

根据this answer,这是我的尝试。它使用窗口大小监听器动态调整绘图的大小(通过在plotOutput调用中使用inline = TRUE实现)。外部容器的宽度是固定的,因此可以直接引用,但高度是动态的,因此我的解决方法是使用窗口高度并减去50个像素。只要有一个单独的绘图元素,并且侧边栏没有被调整为在绘图旁边而不是旁边,这似乎有效。

窗口调整大小被防抖以便只有在半秒钟内没有变化时才调整大小,以便服务器在重绘调用中不会受到太大负担。如果尚未确定尺寸,则代码也不会绘制任何内容,以便没有初始绘图闪烁。

library(shiny)

ui <- fluidPage(
    ## Add a listener for the window height and plot container width
    tags$head(tags$script('
                        var winDims = [0, 0];
                        var plotElt = document;
                        $(document).on("shiny:connected", function(e) {
                            plotElt = document.getElementById("plotContainer");
                            winDims[0] = plotElt.clientWidth;
                            winDims[1] = window.innerHeight;
                            Shiny.onInputChange("winDims", winDims);
                        });
                        $(window).resize(function(e) {
                            winDims[0] = plotElt.clientWidth;
                            winDims[1] = window.innerHeight;
                            Shiny.onInputChange("winDims", winDims);
                        });
                    ')),
    titlePanel("Old Faithful Geyser Data"),
    sidebarLayout(
        sidebarPanel(
            sliderInput("bins",
                        "Number of bins:",
                        min = 1,
                        max = 50,
                        value = 30),
            sliderInput("height", label="Height",
                        min=100, max=900, value = 600)
        ),
        mainPanel(
            tags$div(id="plotContainer", ## Add outer container to make JS constant
                     ## Use an "inline" plot, so that width and height can be set server-side
                     plotOutput("distPlot", inline = TRUE))
        )
    )
)

server <- function(input, output) {
    ## reduce the amount of redraws on window resize
    winDims_d <- reactive(input$winDims) %>% debounce(500)
    ## fetch the changed window dimensions
    getWinX <- function(){
        print(input$winDims);
        if(is.null(winDims_d())) { 400 } else {
            return(winDims_d()[1])
        }
    }
    getWinY <- function(){
        if(is.null(winDims_d())) { 600 } else {
            return(winDims_d()[2] - 50)
        }
    }
    output$distPlot <- renderPlot({
        if(is.null(winDims_d())){
            ## Don't plot anything if we don't yet know the size
            return(NULL);
        }
        x    <- faithful[, 2]
        bins <- seq(min(x), max(x), length.out = input$bins + 1)
        hist(x, breaks = bins, col = 'darkgray', border = 'white')
    }, width = getWinX, height=getWinY)
}

shinyApp(ui = ui, server = server)

网页内容由stack overflow 提供, 点击上面的
可以查看英文原文,
原文链接