我在Shiny中遇到了一个奇怪的问题。我的Shiny应用程序有一个ggvis图,其中包含
layer_points()和几个选项来操作该图。当我运行应用程序时,有时即使我更改所有选项,一切都很好,但有时(我想没有特定的规则)图表会消失。当我更改其中一个选项时,图表会重新出现,但这并不是很好。
我研究了这个问题,但我不知道它是否是我的问题的解决方案。
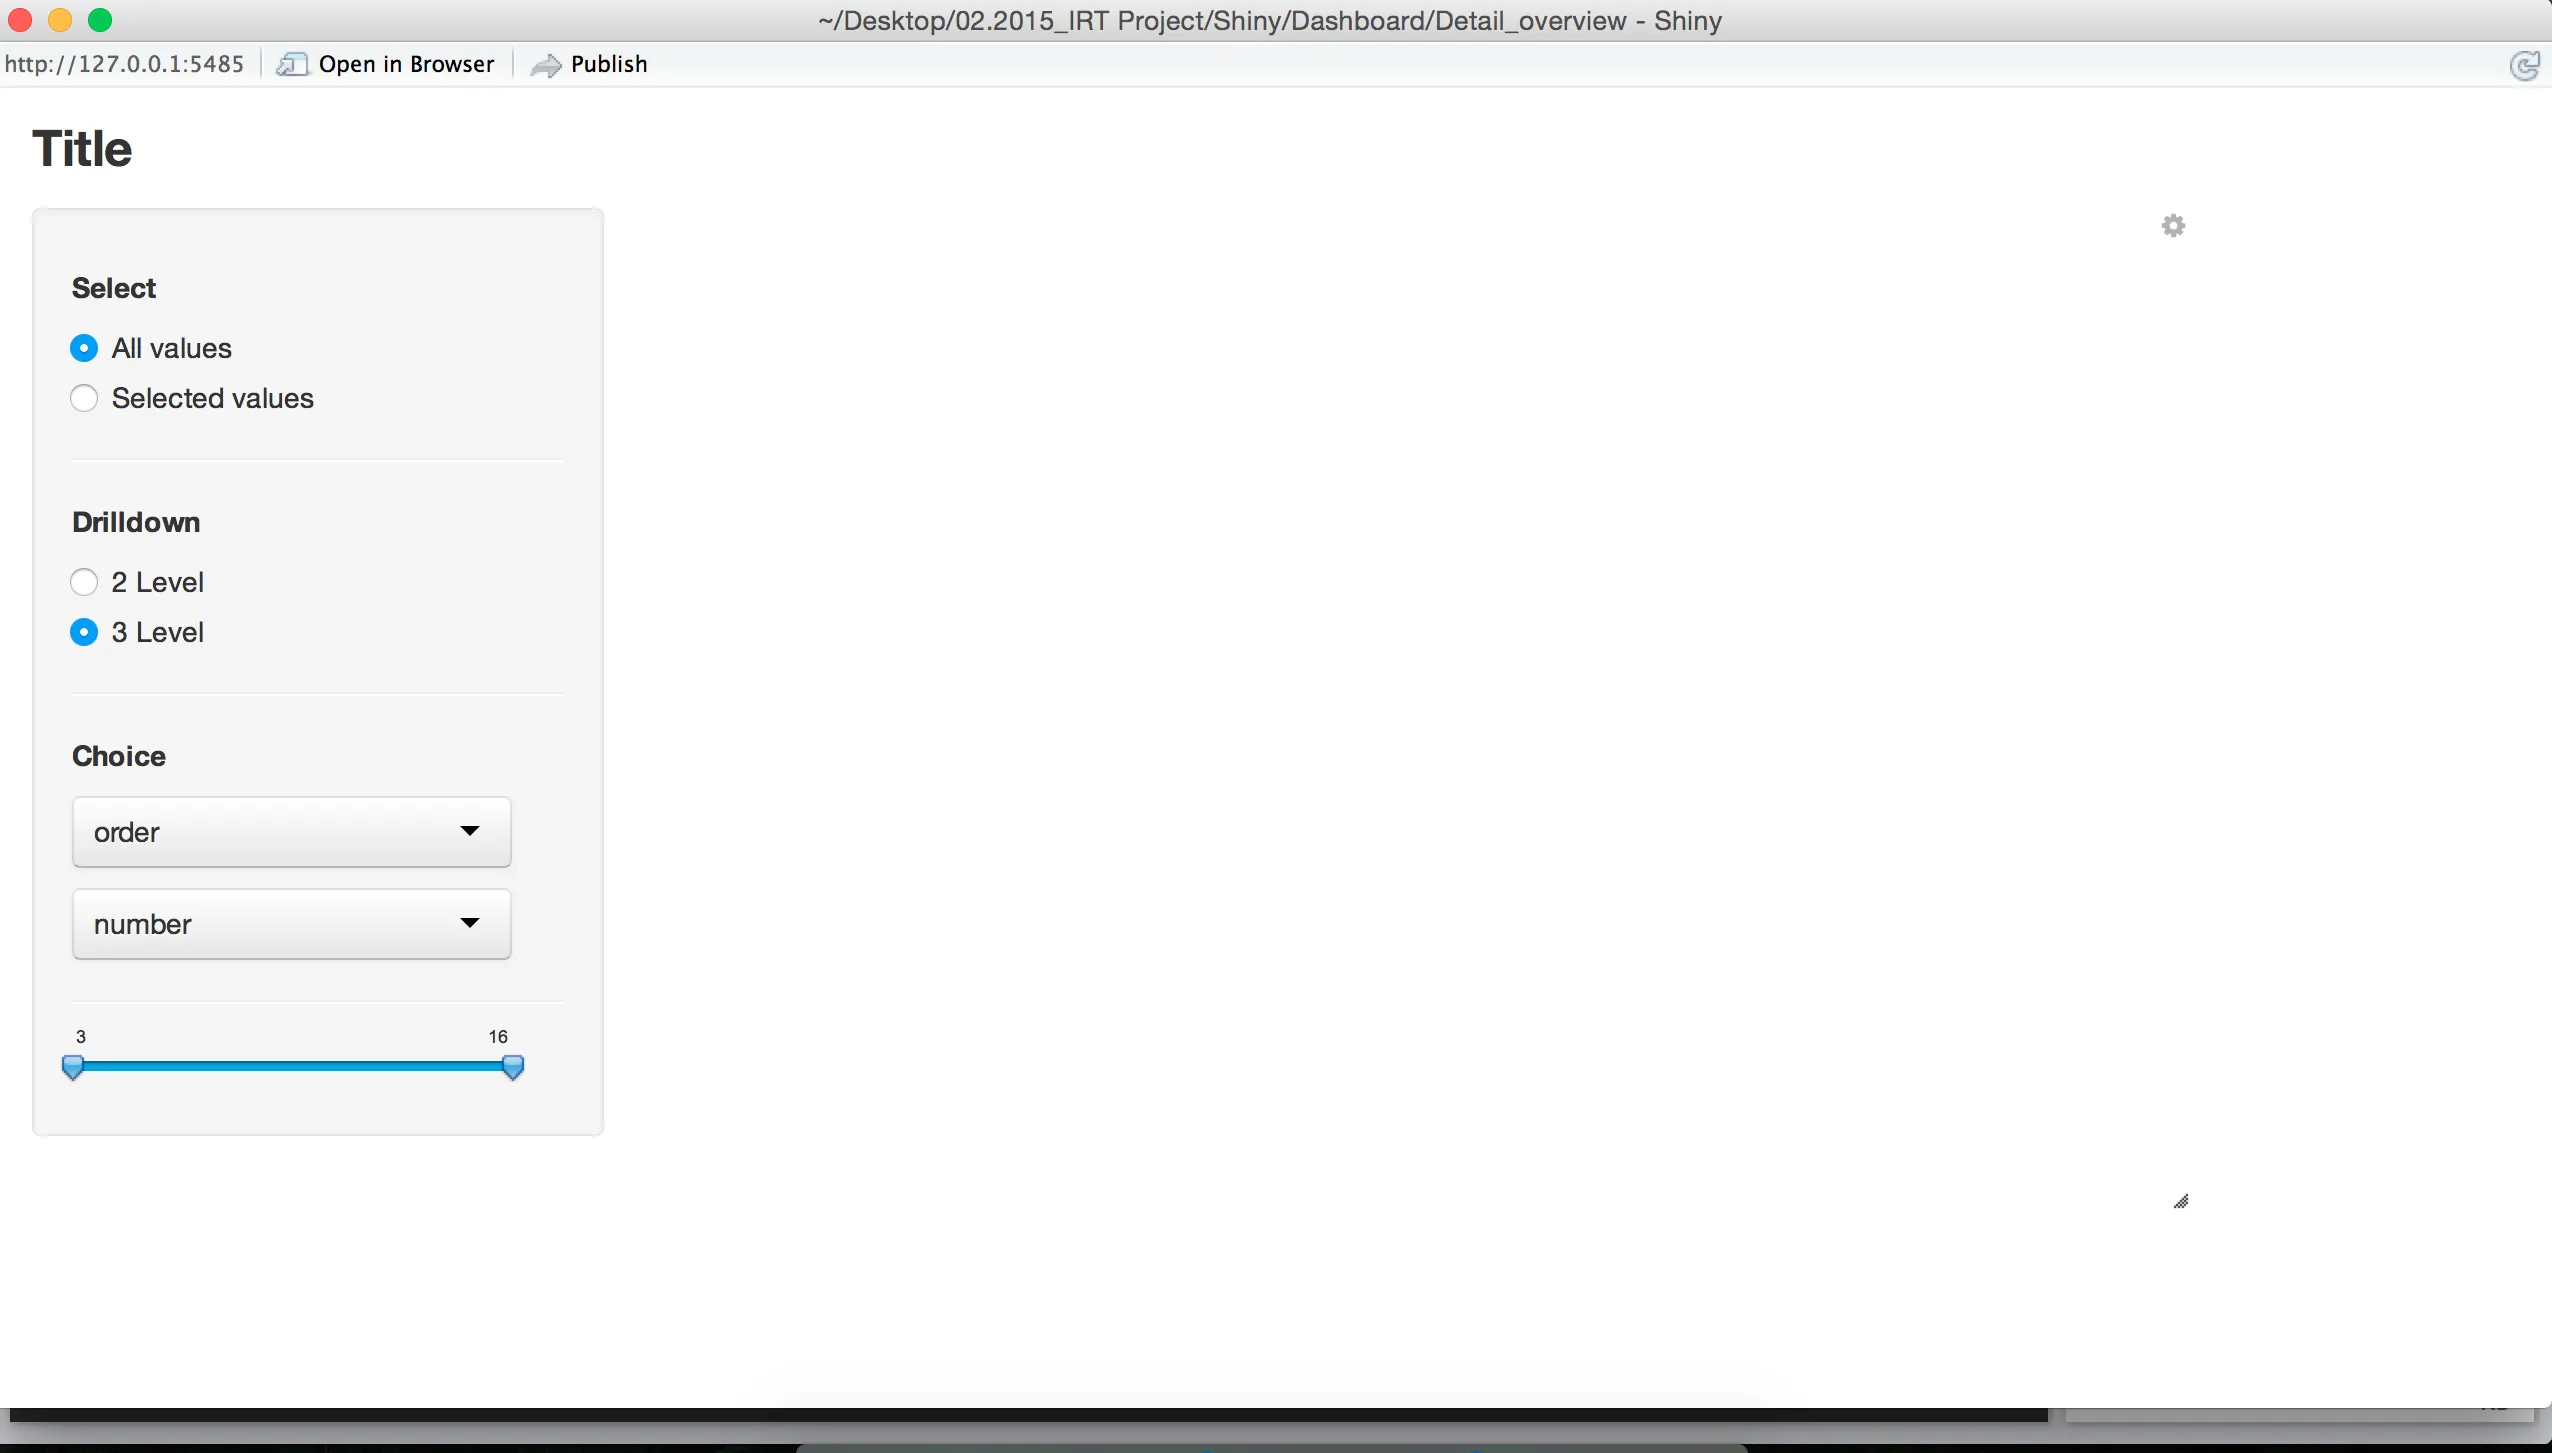
当图表消失时,我的Shiny应用程序如下所示:
ui.R
library(ggvis)
library(markdown)
library(shiny)
library(dplyr)
library(magrittr)

shinyUI(
    fluidPage(
      h3("Title"),
      fluidRow(
        column(3,
               wellPanel(
                 radioButtons("radio",h5("Select"),choices=list("All values","Selected values"),
                              selected="All values"),

                 conditionalPanel(
                   condition = "input.radio != 'All values'",
                   checkboxGroupInput("checkGroup",label = "",
                                      choices,
                                      selected = c("AT1","AT2"))
                 ),
                 hr(),
                 radioButtons("dataset", label = h5("Drilldown"),
                              choices = list("2 Level" = "df1", "3 Level" = "df2")

                 ),
                 hr(),
                 h5("Choice"),
                 selectInput("xvar", h6(""),
                             axis_vars_x,
                             selected = "value"),
                 selectInput("yvar", h6(""),
                             axis_vars_y,
                             selected = "number2"),
                 hr(),
                 uiOutput("slider")
               )
        ),
        column(9,
               ggvisOutput("plot")
        )
      )

    )
  )
server.R
library(shiny)

shinyServer(function(input, output,session) {

  datasetInput <- reactive({
    switch(input$dataset,
           df2 = df2,
           df1 = df1)
  })

  axis_vara_y <- reactive({
    switch(input$yvar,
           number = 2,
           number2 = 3)
  })


  output$slider <- renderUI({
    sliderInput("inslider",h5(""), min   = round(min(datasetInput()[,axis_vara_y()]),0)-1,
                max   = round(max(datasetInput()[,axis_vara_y()]),0)+1,
                value = c(round(min(datasetInput()[,axis_vara_y()]),0)-1,
                          round(max(datasetInput()[,axis_vara_y()]),0)+1),
                step  = 0.5)
  })

  data <- reactive({
    filteredData <- datasetInput()
    axisData <- axis_vara_y()

    if(!is.null(input$inslider)){
      if(input$radio == "All values"){
        filteredData <- filteredData %>%
          filter(filteredData[,axisData] >= input$inslider[1],
                 filteredData[,axisData] <= input$inslider[2])
      }
      else {
        filteredData <- filteredData %>%
          filter(value %in% input$checkGroup,
                 filteredData[,axisData] >= input$inslider[1],
                 filteredData[,axisData] <= input$inslider[2])
      }
    }
    return(filteredData)
  })

  data_point <- reactive({
    data() %>%
      mutate(id = row_number())

  })

  xvar <- reactive(as.symbol(input$xvar))
  yvar <- reactive(as.symbol(input$yvar))

  dotpoint_vis <- reactive({

      xvar_name <- names(axis_vars_x)[axis_vars_x == input$xvar]
      yvar_name <- names(axis_vars_y)[axis_vars_y == input$yvar]


    data_point_detail <- data_point()

    plot <- data_point_detail %>%
      ggvis(x = xvar(),y =  yvar()) %>%
      layer_points(size := 120,fill = ~value) %>%
      add_axis("x", title = xvar_name) %>%
      add_axis("y", title = yvar_name) %>%
      set_options(width = 750, height = 500, renderer = "canvas")

  })
  dotpoint_vis %>% bind_shiny("plot")

})
global.R
choices <- list("Value1" = "AT1", "Value2" = "AT2",
                "Value3" = "AT3", "Value4" = "AT4",
                "Value5" = "AT5", "Value6" = "RT1",
                "Value7" = "AT6", "Value8" = "AT7",
                "Value9" = "AT8", "Value10" = "AT9",
                "Value11" = "AT10", "Value12" = "RT2")

levele <- c("AT1","AT2","AT3","AT4","AT5","RT1","AT6","AT7","AT8","AT9","AT10","RT2")

df1 <- data.frame(value = levele,number = seq(2,46,4), number2 = seq(2,24,2),order = 1:12)

df2 <- data.frame(value = levele,number = rep(4:15), number2 = rep(4:9,each = 2),order = 1:12)

df1$value <- factor(df1$value, levels = levele)
df2$value <- factor(df2$value, levels = levele)

axis_vars_y <- c("number","number2")
axis_vars_x <- c("value", "order","number","number2")
更新
我也不知道ggvis中的动画发生了什么。