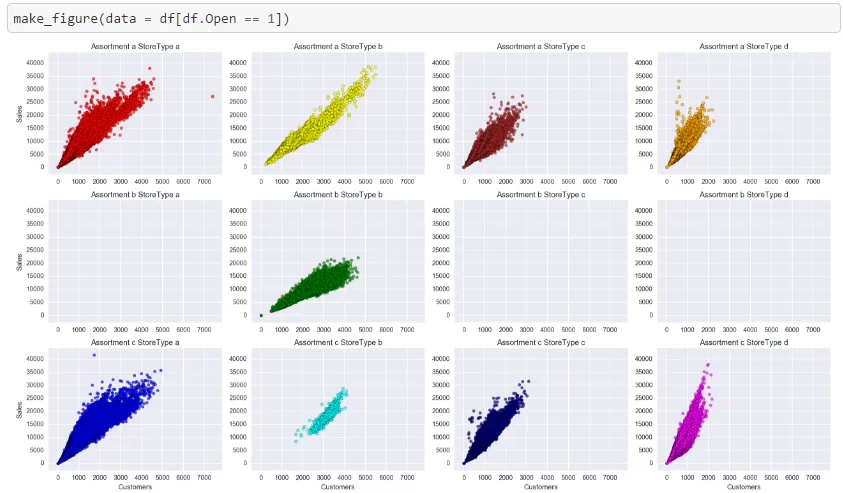
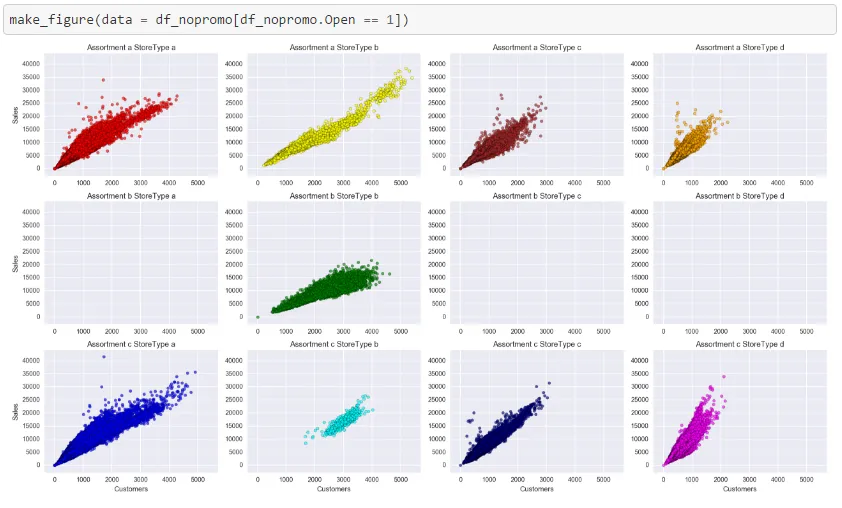
我正在使用matplotlib,想要比较两个数据集的图形,并保持x和y轴对于两个数据集相同。然而,由于数据集2有更小的范围,因此自动缩放总是干扰并重新调整我的图形大小。如下图所示。
def make_figure(data, param ='Customers'):  # default param is Customers
    fig = plt.figure(figsize = (18,10))

    xticks = np.arange(0, 10000, 1000)
    yticks = np.arange(0, 55000, 5000)

    i = 0
    colors = ['red','yellow','brown','orange','green','green','green','green','blue','cyan','navy','magenta']

    ax1 = fig.add_subplot(3,4,1)
    ax1.set_xticks(xticks)
    ax1.set_yticks(yticks)
    ax1.autoscale(False, tight=False)

    for assortment in ['a','b','c']:
        for storetype in ['a','b','c','d']:

            datax = data[param][data.StoreType == storetype][data.Assortment == assortment]
            datay = data['Sales'][data.StoreType == storetype][data.Assortment == assortment]
            plt.subplot(3, 4, i+1, sharex=ax1, sharey=ax1)
            plt.title('Assortment ' + assortment + ' StoreType ' + storetype)
            plt.scatter(y = datay, x = datax, c=colors[i], alpha=.65)

            if i % 4 == 0:
                plt.ylabel('Sales')

            if i >= 8:
                plt.xlabel(str(param))

            i += 1

    plt.tight_layout()

    return plt.show()
数据集1
数据集2
fig, ax_array = plt.subplots(4, 4, sharex='all', sharey='all')并循环遍历ax_array中的轴对象(它是一个4x4的numpy数组),这样做可能会更好。 - tacaswell