我有一组UNIX时间戳和URI,我想绘制每个URI的请求累计计数。我已经成功为一个URI使用虚拟列完成了这个操作:
x.df$count <- apply(x.df,1,function(row) 1) # Create a dummy column for cumsum
x.df <- x.df[order(x.df$time, decreasing=FALSE),] # Sort
ggplot(x.df, aes(x=time, y=cumsum(count))) + geom_line()
然而,在我的情况下,这将导致大约30个图。
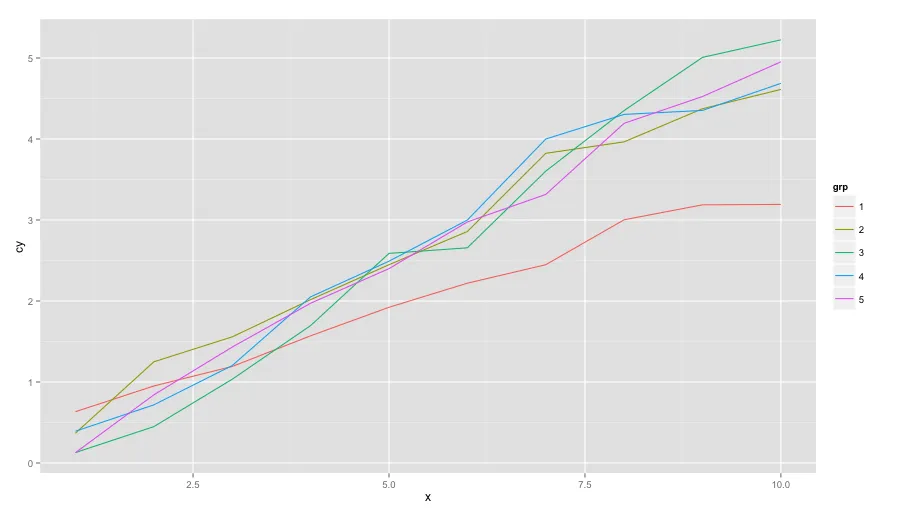
ggplot2确实允许您将多条线绘制到一个图中(我从这里复制了这段代码):
ggplot(data=test_data_long, aes(x=date, y=value, colour=variable)) +
    geom_line()
问题在于,这种方式下,
cumsum()会一直累加。有人有什么想法吗?
plyr或data.table的工作。将数据按 URI 拆分,然后在每个片段上使用cumsum。data.table(x); x[, list(count=.I), by=URI]或类似的东西... - Justin