反转图例的顺序

59

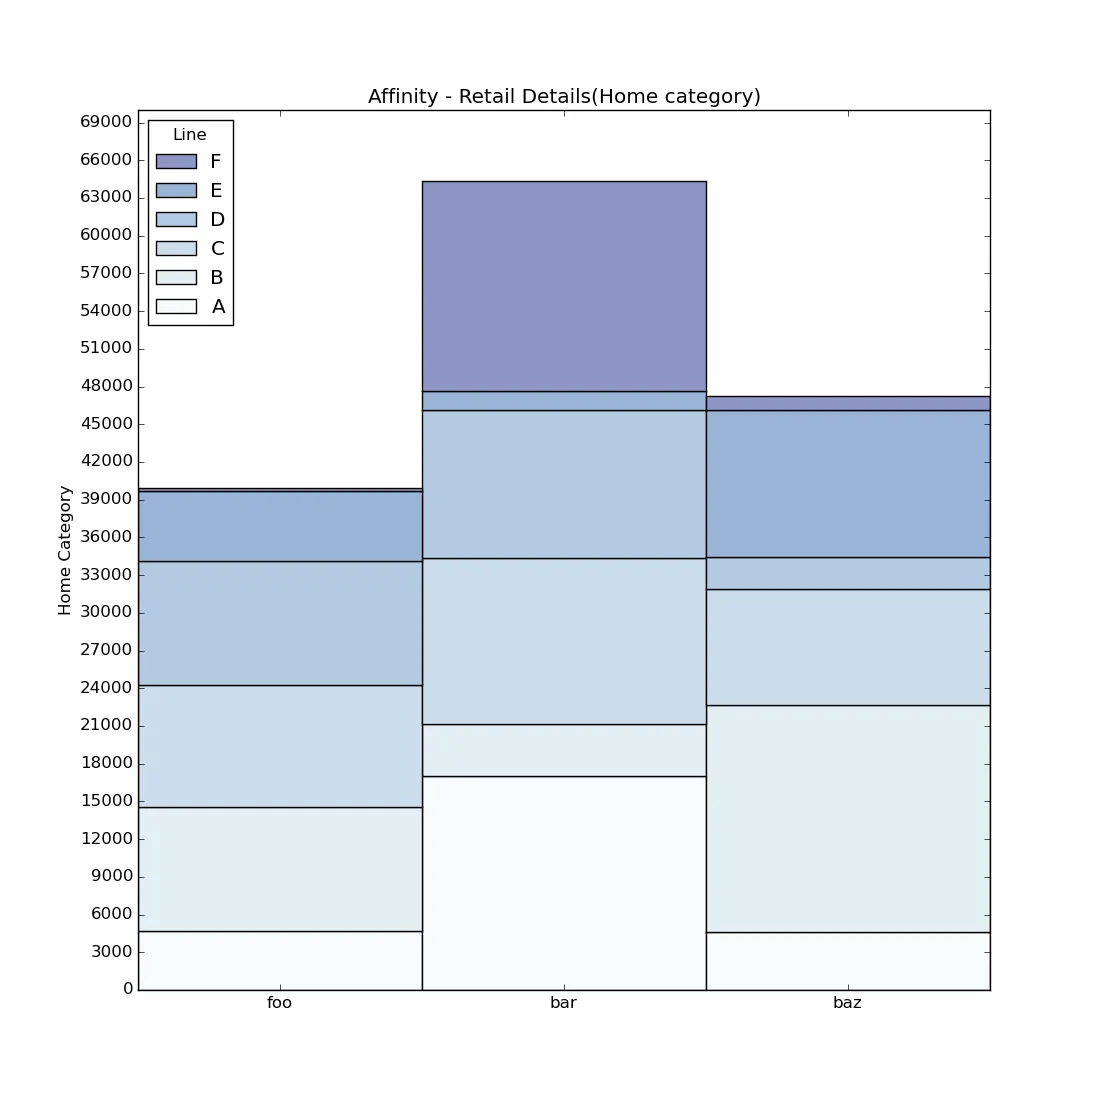
我使用以下代码绘制条形图,并需要以相反的顺序呈现图例。我该如何做?

colorsArr = plt.cm.BuPu(np.linspace(0, 0.5, len(C2)))
p = numpy.empty(len(C2), dtype=object)
plt.figure(figsize=(11, 11))

prevBar = 0
for index in range(len(C2)):
    plt.bar(ind, C2[index], width, bottom=prevBar, color=colorsArr[index],
            label=C0[index])
    prevBar = prevBar + C2[index]

# Positions of the x-axis ticks (center of the bars as bar labels)
tick_pos = [i + (width/2) for i in ind]

plt.ylabel('Home Category')
plt.title('Affinity - Retail Details(Home category)')

# Set the x ticks with names
plt.xticks(tick_pos, C1)
plt.yticks(np.arange(0, 70000, 3000))
plt.legend(title="Line", loc='upper left')

# Set a buffer around the edge
plt.xlim(-width*2, width*2)
plt.show()
5个回答

92

您可以称之为

handles, labels = ax.get_legend_handles_labels()
ax.legend(handles[::-1], labels[::-1], title='Line', loc='upper left')

import numpy as np
import matplotlib.pyplot as plt
np.random.seed(2016)

C0 = list('ABCDEF')
C2 = np.random.randint(20000, size=(len(C0), 3))
width = 1.0
C1 = ['foo', 'bar', 'baz']
ind = np.linspace(-width, width, len(C1))


colorsArr = plt.cm.BuPu(np.linspace(0, 0.5, len(C2)))
fig = plt.figure(figsize=(11,11))
ax = fig.add_subplot(1, 1, 1)

prevBar = 0
for height, color, label in zip(C2, colorsArr, C0):
    h = ax.bar(ind, height, width, bottom=prevBar, color=color, label=label)
    prevBar = prevBar + height

plt.ylabel('Home Category')
plt.title('Affinity - Retail Details(Home category)')

# positions of the x-axis ticks (center of the bars as bar labels)
tick_pos = [i+(width/2.0) for i in ind]
# set the x ticks with names
plt.xticks(tick_pos, C1)
plt.yticks(np.arange(0,70000,3000))

handles, labels = ax.get_legend_handles_labels()
ax.legend(handles[::-1], labels[::-1], title='Line', loc='upper left')

plt.show()

输入图像描述


25

或者您可以使用更简单的方法

handles, labels = ax.get_legend_handles_labels()
ax.legend(reversed(handles), reversed(labels), title='Line', loc='upper left')

3
ax.legend(*map(reversed, ax.get_legend_handles_labels()), ...) 可以翻译成:ax.legend(*map(reversed, ax.get_legend_handles_labels()), ...) - user66081
@user66081:请解释一下你的更正,因为原始解决方案似乎完美地工作,并且类似于使用负步长切片和无映射的选定答案。 - mins
@mins:我想原因是你不需要记住哪个先来,而且你可以在IDE的建议列表中找到get_legend_handles_labels。此外,负步长切片很丑陋。 - user66081

9

使用负数作为图例垂直间距,示例如下:

matplotlib.pyplot.stackplot(X, *revDataValues,
    linewidth=1.0,
    edgecolor='black')

matplotlib.pyplot.legend(revNames,
    loc=6, bbox_to_anchor=(1.05, 0.5),
    labelspacing=-2.5, frameon=False,         # reverse legend
    fontsize=9.0)

带有反转图例的堆叠面积图


*revDataValues是什么? - Soren
我认为这个不起作用。我想要在图例中交换项目,而不是在图表中。 - Soren
2
我喜欢这个的优雅性 - 但它会导致我的图例中的一些项目超出框架。 - Jeffrey Benjamin Brown
1
这是我见过的最被低估的答案 - 非常优雅 - Mr. Vanderstelt
非常优雅的解决方案。frameon=False将解决标签超出框的问题。 - Mohammed

7
最新版本的matplotlib(>=3.7)现在已经提供了这个功能:
plt.legend(title="Line", loc='upper left', reverse=True)

默认设置为 reverse=False(以前的行为)- 将其设置为 reverse=True 现在将以与堆叠条形图相同的顺序显示图例中的条目。请参见 Axes.legend文档


5

我没有测试过,因为我没有你的数据,但这是基于这里的文档控制图例条目

handles = []
for index in range(len(C2)):
    h = plt.bar(ind, C2[index], width, bottom=prevBar, color=colorsArr[index], label=C0[index])
    handles.append(h)
    prevBar = prevBar + C2[index]

plt.legend(title="Line", loc='upper left', handles=handles[::-1])

这个答案中的 C2 是什么? - Richard
1
与问题中的 C2 相同,我想象一样。 - Jamie Bull
AttributeError: 'list' object has no attribute 'get_label' - Raphael
刚刚加了一个逗号就解决了:h, = plt.plot[...] - Raphael

网页内容由stack overflow 提供, 点击上面的
可以查看英文原文,
原文链接