我正在使用nginx和uwsgi运行Django应用程序。以下是我运行uwsgi的方法:
sudo uwsgi -b 25000 --chdir=/www/python/apps/pyapp --module=wsgi:application --env DJANGO_SETTINGS_MODULE=settings --socket=/tmp/pyapp.socket --cheaper=8 --processes=16 --harakiri=10 --max-requests=5000 --vacuum --master --pidfile=/tmp/pyapp-master.pid --uid=220 --gid=499
& nginx配置:
server {
    listen 80;
    server_name test.com

    root /www/python/apps/pyapp/;

    access_log /var/log/nginx/test.com.access.log;
    error_log /var/log/nginx/test.com.error.log;

    # https://docs.djangoproject.com/en/dev/howto/static-files/#serving-static-files-in-production
    location /static/ {
        alias /www/python/apps/pyapp/static/;
        expires 30d;
    }

    location /media/ {
        alias /www/python/apps/pyapp/media/;
        expires 30d;
    }

    location / {
        uwsgi_pass unix:///tmp/pyapp.socket;
        include uwsgi_params;
        proxy_read_timeout 120;
    }

    # what to serve if upstream is not available or crashes
    #error_page 500 502 503 504 /media/50x.html;
}
问题来了。在服务器上执行“ab”(ApacheBenchmark)时,我得到了以下结果:
nginx版本:nginx/1.2.6
uwsgi版本:1.4.5
Server Software:        nginx/1.0.15
Server Hostname:        pycms.com
Server Port:            80

Document Path:          /api/nodes/mostviewed/8/?format=json
Document Length:        8696 bytes

Concurrency Level:      100
Time taken for tests:   41.232 seconds
Complete requests:      1000
Failed requests:        0
Write errors:           0
Total transferred:      8866000 bytes
HTML transferred:       8696000 bytes
Requests per second:    24.25 [#/sec] (mean)
Time per request:       4123.216 [ms] (mean)
Time per request:       41.232 [ms] (mean, across all concurrent requests)
Transfer rate:          209.99 [Kbytes/sec] received
在并发级别达到500时运行
oncurrency Level:      500
Time taken for tests:   2.175 seconds
Complete requests:      1000
Failed requests:        50
   (Connect: 0, Receive: 0, Length: 50, Exceptions: 0)
Write errors:           0
Non-2xx responses:      950
Total transferred:      629200 bytes
HTML transferred:       476300 bytes
Requests per second:    459.81 [#/sec] (mean)
Time per request:       1087.416 [ms] (mean)
Time per request:       2.175 [ms] (mean, across all concurrent requests)
Transfer rate:          282.53 [Kbytes/sec] received
正如您所看到的,服务器上的所有请求都会失败,要么是超时错误,要么是“客户端过早断开连接”,或者:
writev(): Broken pipe [proto/uwsgi.c line 124] during GET /api/nodes/mostviewed/9/?format=json
关于我的应用程序,以下是更多信息: 基本上,它是一组反映MySQL表格的模型,这些表格包含所有内容。在前端,我使用Django Rest Framework向客户端提供JSON内容。
我已经安装了Django Profiling和Django Debug Toolbar来查看发生了什么。在运行单个请求时,Django Profiling给出以下结果:
Instance wide RAM usage

Partition of a set of 147315 objects. Total size = 20779408 bytes.
 Index  Count   %     Size   % Cumulative  % Kind (class / dict of class)
     0  63960  43  5726288  28   5726288  28 str
     1  36887  25  3131112  15   8857400  43 tuple
     2   2495   2  1500392   7  10357792  50 dict (no owner)
     3    615   0  1397160   7  11754952  57 dict of module
     4   1371   1  1236432   6  12991384  63 type
     5   9974   7  1196880   6  14188264  68 function
     6   8974   6  1076880   5  15265144  73 types.CodeType
     7   1371   1  1014408   5  16279552  78 dict of type
     8   2684   2   340640   2  16620192  80 list
     9    382   0   328912   2  16949104  82 dict of class
<607 more rows. Type e.g. '_.more' to view.>


CPU Time for this request

         11068 function calls (10158 primitive calls) in 0.064 CPU seconds

   Ordered by: cumulative time

   ncalls  tottime  percall  cumtime  percall filename:lineno(function)
        1    0.000    0.000    0.064    0.064 /usr/lib/python2.6/site-packages/django/views/generic/base.py:44(view)
        1    0.000    0.000    0.064    0.064 /usr/lib/python2.6/site-packages/django/views/decorators/csrf.py:76(wrapped_view)
        1    0.000    0.000    0.064    0.064 /usr/lib/python2.6/site-packages/rest_framework/views.py:359(dispatch)
        1    0.000    0.000    0.064    0.064 /usr/lib/python2.6/site-packages/rest_framework/generics.py:144(get)
        1    0.000    0.000    0.064    0.064 /usr/lib/python2.6/site-packages/rest_framework/mixins.py:46(list)
        1    0.000    0.000    0.038    0.038 /usr/lib/python2.6/site-packages/rest_framework/serializers.py:348(data)
     21/1    0.000    0.000    0.038    0.038 /usr/lib/python2.6/site-packages/rest_framework/serializers.py:273(to_native)
     21/1    0.000    0.000    0.038    0.038 /usr/lib/python2.6/site-packages/rest_framework/serializers.py:190(convert_object)
     11/1    0.000    0.000    0.036    0.036 /usr/lib/python2.6/site-packages/rest_framework/serializers.py:303(field_to_native)
    13/11    0.000    0.000    0.033    0.003 /usr/lib/python2.6/site-packages/django/db/models/query.py:92(__iter__)
      3/1    0.000    0.000    0.033    0.033 /usr/lib/python2.6/site-packages/django/db/models/query.py:77(__len__)
        4    0.000    0.000    0.030    0.008 /usr/lib/python2.6/site-packages/django/db/models/sql/compiler.py:794(execute_sql)
        1    0.000    0.000    0.021    0.021 /usr/lib/python2.6/site-packages/django/views/generic/list.py:33(paginate_queryset)
        1    0.000    0.000    0.021    0.021 /usr/lib/python2.6/site-packages/django/core/paginator.py:35(page)
        1    0.000    0.000    0.020    0.020 /usr/lib/python2.6/site-packages/django/core/paginator.py:20(validate_number)
        3    0.000    0.000    0.020    0.007 /usr/lib/python2.6/site-packages/django/core/paginator.py:57(_get_num_pages)
        4    0.000    0.000    0.020    0.005 /usr/lib/python2.6/site-packages/django/core/paginator.py:44(_get_count)
        1    0.000    0.000    0.020    0.020 /usr/lib/python2.6/site-packages/django/db/models/query.py:340(count)
        1    0.000    0.000    0.020    0.020 /usr/lib/python2.6/site-packages/django/db/models/sql/query.py:394(get_count)
        1    0.000    0.000    0.020    0.020 /usr/lib/python2.6/site-packages/django/db/models/query.py:568(_prefetch_related_objects)
        1    0.000    0.000    0.020    0.020 /usr/lib/python2.6/site-packages/django/db/models/query.py:1596(prefetch_related_objects)
        4    0.000    0.000    0.020    0.005 /usr/lib/python2.6/site-packages/django/db/backends/util.py:36(execute)
        1    0.000    0.000    0.020    0.020 /usr/lib/python2.6/site-packages/django/db/models/sql/query.py:340(get_aggregation)
        5    0.000    0.000    0.020    0.004 /usr/lib64/python2.6/site-packages/MySQLdb/cursors.py:136(execute)
        2    0.000    0.000    0.020    0.010 /usr/lib/python2.6/site-packages/django/db/models/query.py:1748(prefetch_one_level)
        4    0.000    0.000    0.020    0.005 /usr/lib/python2.6/site-packages/django/db/backends/mysql/base.py:112(execute)
        5    0.000    0.000    0.019    0.004 /usr/lib64/python2.6/site-packages/MySQLdb/cursors.py:316(_query)
       60    0.000    0.000    0.018    0.000 /usr/lib/python2.6/site-packages/django/db/models/query.py:231(iterator)
        5    0.012    0.002    0.015    0.003 /usr/lib64/python2.6/site-packages/MySQLdb/cursors.py:278(_do_query)
       60    0.000    0.000    0.013    0.000 /usr/lib/python2.6/site-packages/django/db/models/sql/compiler.py:751(results_iter)
       30    0.000    0.000    0.010    0.000 /usr/lib/python2.6/site-packages/django/db/models/manager.py:115(all)
       50    0.000    0.000    0.009    0.000 /usr/lib/python2.6/site-packages/django/db/models/query.py:870(_clone)
       51    0.001    0.000    0.009    0.000 /usr/lib/python2.6/site-packages/django/db/models/sql/query.py:235(clone)
        4    0.000    0.000    0.009    0.002 /usr/lib/python2.6/site-packages/django/db/backends/__init__.py:302(cursor)
        4    0.000    0.000    0.008    0.002 /usr/lib/python2.6/site-packages/django/db/backends/mysql/base.py:361(_cursor)
        1    0.000    0.000    0.008    0.008 /usr/lib64/python2.6/site-packages/MySQLdb/__init__.py:78(Connect)
  910/208    0.003    0.000    0.008    0.000 /usr/lib64/python2.6/copy.py:144(deepcopy)
       22    0.000    0.000    0.007    0.000 /usr/lib/python2.6/site-packages/django/db/models/query.py:619(filter)
       22    0.000    0.000    0.007    0.000 /usr/lib/python2.6/site-packages/django/db/models/query.py:633(_filter_or_exclude)
       20    0.000    0.000    0.005    0.000 /usr/lib/python2.6/site-packages/django/db/models/fields/related.py:560(get_query_set)
        1    0.000    0.000    0.005    0.005 /usr/lib64/python2.6/site-packages/MySQLdb/connections.py:8()
然而,django-debug-toolbar 显示如下:
Resource Usage
Resource    Value
User CPU time   149.977 msec
System CPU time 119.982 msec
Total CPU time  269.959 msec
Elapsed time    326.291 msec
Context switches    11 voluntary, 40 involuntary

and 5 queries in 27.1 ms
编辑(23/02/2013):根据Andrew Alcock的回答添加更多细节: 需要注意/回答的要点是 (3)(3)我在MySQL上执行了“show global variables”,发现MySQL配置中max_connections设置为151,这足以为我启动的uwsgi工作线程提供服务。
(3)(4)(2)我正在分析的单个请求是最重的请求。根据django-debug-toolbar,它执行了4个查询。发生的情况是所有查询都在以下时间内运行:3.71、2.83、0.88、4.84毫秒。
(4)这里指的是内存分页吗?如果是的话,我该怎么办?
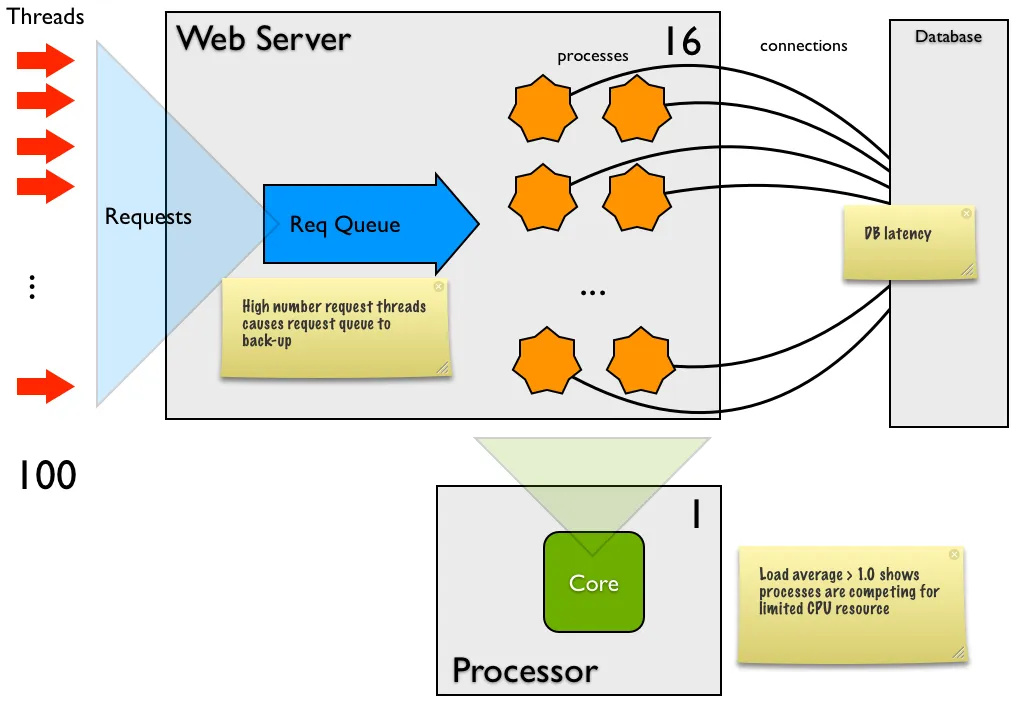
(5)在16个工作线程、100并发率、1000个请求的情况下,负载平均值会上升到约12。我在不同数量的工作线程上运行了测试(并发级别为100):
1个工作线程,负载平均值~1.85,19个请求/秒,每个请求的时间:5229.520,0个非2xx; 2个工作线程,负载平均值~1.5,19个请求/秒,每个请求的时间:516.520,0个非2xx; 4个工作线程,负载平均值~3,16个请求/秒,每个请求的时间:5929.921,0个非2xx; 8个工作线程,负载平均值~5,18个请求/秒,每个请求的时间:5301.458,0个非2xx; 16个工作线程,负载平均值~19,15个请求/秒,每个请求的时间:6384.720,0个非2xx。
正如您所看到的,我们拥有的工作线程越多,系统上的负载就越大。我可以在uwsgi的守护程序日志中看到,当我增加工作线程数时,响应时间(以毫秒为单位)会增加。
在16个工作线程、500并发级别请求下运行时,uwsgi开始记录错误:
writev(): Broken pipe [proto/uwsgi.c line 124]
负载高达约10,由于非2xx响应达到1000个中的923个,因此测试时间不长,这也是响应速度快的原因,因为它几乎是空的。 这也是对总结中第4点的回复。
假设我在这里面临的是基于I/O和网络的操作系统延迟,建议采取什么措施扩展规模? 新硬件? 更大的服务器?
谢谢