使用Python将GDAL转换比例并保存为JPG

3

我知道如何使用GDAL translate命令行工具来缩放并保存为JPG格式:

gdal_translate image.bsq image.jpg -of JPEG -outsize 10% 10% -scale
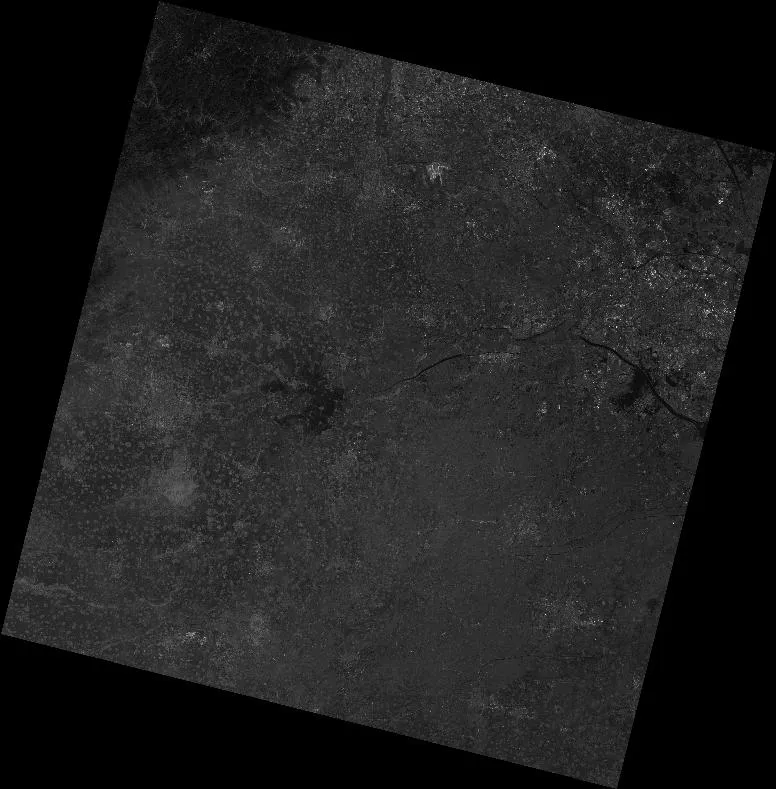
这将生成一个“好看”的图片:

enter image description here

我想通过Python生成类似的图片,像这样:

from osgeo import gdal
img_bsq  = 'image.bsq'
img_jpg  = 'image.jpg'  
gdal.Translate(img_jpg, img_bsq, format='JPEG', width=1024, height=0, scaleParams=[[500,1000,10,20]])

我认为问题在于如何正确选择scaleParams。根据man gdal_translate的说明,cmd行中的-scale会自动计算值:

-scale [src_min src_max [dst_min dst_max]]:
           Rescale the input pixels values from the range src_min to src_max to the range dst_min to dst_max. If omitted the output range is 0
           to 255. If omitted the input range is automatically computed from the source data.

有没有关于如何选择scaleParams(或其他相关选项)的提示?

1个回答

8
你也可以在这里留空,例如:

gdal.Translate(img_jpg, img_bsq, format='JPEG', width=1024, height=0, scaleParams=[[]])

这会导致GDAL自己猜测,如文档所述:
-scale [src_min src_max [dst_min dst_max]]: 将输入像素值从src_min到src_max的范围重新调整为dst_min到dst_max的范围。如果省略,则输出范围为0到255。如果省略,则输入范围将自动从源数据中计算出来。 http://www.gdal.org/gdal_translate.html 或者,您也可以检索统计信息(每个波段),并自行创建一些内容。
获取统计信息:
ds = gdal.Open('img_bsq')
stats = [ds.GetRasterBand(i+1).GetStatistics(True, True) for i in range(ds.RasterCount)]
ds = None

vmin, vmax, vmean, vstd = zip(*stats)

根据这些统计数据,您应该能够想出一些所需的拉伸方法。如果您想在每个频段之间按比例缩放到最小值和最大值,则可以执行以下操作:

scaleParams = list(zip(*[vmin, vmax]))

如果您想使用最高和最低(在所有频段上)的绝对值:
scaleParams = [[min(vmin), max(vmax)]]

etc.


一个小细节,必须使用 scaleParams=[[]] 来进行自动化处理。 - KcFnMi
@KcFnMi 你说得对,我会编辑这篇文章。如果使用单括号,它只会剪切到字节。 - Rutger Kassies

网页内容由stack overflow 提供, 点击上面的
可以查看英文原文,
原文链接