在Visual Studio Code中进行调试?

8

我按照https://github.com/Microsoft/vscode-react-native中的说明进行了VSCode调试。我使用USB电缆将我的Nexus 6P连接到我的MBP2015上,并启用了开发人员选项和USB调试,但是当我在VSC中选择Debug Android时,出现了以下情况:

[Error] "Could not debug. Android project not found."
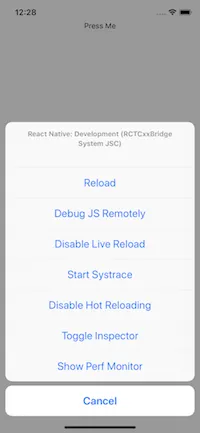
我也附上了图片。

如果我想在 IOS 模拟器上进行调试,我会在 VSC 中选择 Debug IOS,但之后我会收到以下的信息,模拟器无法启动。

[vscode-react-native] Prewarming bundle cache. This may take a while ...
[vscode-react-native] Building and running application.
[vscode-react-native] Executing command: react-native run-ios --simulator
Scanning 772 folders for symlinks in /Users/me/reactnativework/my-app/node_modules (4ms)
ENOENT: no such file or directory, uv_chdir
[Error] "Could not debug. Error while executing command 'react-native run-ios --simulator': Error while executing command 'react-native run-ios --simulator'"

我在这里看到了几篇有关类似问题的帖子,但没有一个得到答案或与我的问题不同。

如何使用断点调试React Native最简单的应用程序?以便我可以在Visual Studio Code中跟踪代码执行过程?

这是我的launch.json:

{
    // Use IntelliSense to learn about possible attributes.
    // Hover to view descriptions of existing attributes.
    // For more information, visit: https://go.microsoft.com/fwlink/?linkid=830387
    "version": "0.2.0",
    "configurations": [
        {
            "name": "Debug Android",
            "program": "${workspaceRoot}/.vscode/launchReactNative.js",
            "type": "reactnative",
            "request": "launch",
            "platform": "android",
            "sourceMaps": true,
            "outDir": "${workspaceRoot}/.vscode/.react"
        },
        {
            "name": "Debug iOS",
            "program": "${workspaceRoot}/.vscode/launchReactNative.js",
            "type": "reactnative",
            "request": "launch",
            "platform": "ios",
            "sourceMaps": true,
            "outDir": "${workspaceRoot}/.vscode/.react"
        },
        {
            "name": "Attach to packager",
            "program": "${workspaceRoot}/.vscode/launchReactNative.js",
            "type": "reactnative",
            "request": "attach",
            "sourceMaps": true,
            "outDir": "${workspaceRoot}/.vscode/.react"
        },
        {
            "name": "Debug in Exponent",
            "program": "${workspaceRoot}/.vscode/launchReactNative.js",
            "type": "reactnative",
            "request": "launch",
            "platform": "exponent",
            "sourceMaps": true,
            "outDir": "${workspaceRoot}/.vscode/.react"
        }
    ]
}
6个回答

9
请按照以下步骤操作:
  • 安装扩展程序 React-native Full Pack

enter image description here

  • 创建 Launch.json 文件

enter image description here

  • 选择 Debug iOSAndroid,添加断点并享受。

enter image description here

注意:请确保启用 Debug JS Remotely

enter image description here

现在可以喝杯咖啡放松一下了!


@RudolphOpperman,关于这个问题你有任何更新吗?如果有,请在这里分享。 - Tunvir Rahman Tusher
很遗憾,没有。我只是想出了一个解决办法。但是既然这只是一个有趣的项目,那就够了。 - Rudolph Opperman
@TunvirRahmanTusher 你能请说明一下 VS code 的版本吗?我正在使用最新版本的 VS code 与 TS 进行我的 React Native 项目,每一次更改和保存都会丢失断点并出现源映射错误。 - Akash Gorai
@AkashGorai 版本:1.59.0 - Tunvir Rahman Tusher
很遗憾,对于TypeScript项目来说情况仍然是一样的。一旦您更改了代码,调试器将无法使用断点。 - Akash Gorai
显示剩余6条评论

6

有几种方法可以使用vs code启用断点调试

  1. 使用vs code运行打包程序和调试器:Debug Android / Debug iOS
  2. 使用指数
  3. 附加到打包器

就我个人而言,在vs code中最稳定的调试方式是使用第三个选项,即“附加到打包器”。

要使用此功能,您可以启动外部打包器(例如从命令行),并将调试器附加到该打包器端口。

    {
        "name": "Attach to packager",
        "program": "${workspaceRoot}/.vscode/launchReactNative.js",
        "type": "reactnative",
        "request": "attach",
        "port": 19002, // change this with your port
        "sourceMaps": true,
        "outDir": "${workspaceRoot}/.vscode/.react"
    },

另外两个选项总是导致多实例打包程序并引起打包程序错误,最终花费时间杀死端口。至少对我来说,使用附加到打包程序会更加舒适。

如果您使用exponent创建应用程序,则无法运行Debug Android / Debug iOS,唯一的选择是使用exponent中的Debug或仍然可以使用与以前相同的方法附加到打包程序。


嗨,Ganesh,这听起来很复杂。“启动外部包....”。??? - pixel
我在进行操作时遇到了错误“ReferenceError: fetch is not defined”,出现在“debuggerWorker.js:135”中。 - Dennis

6
有一种方法可以通过仅需点击一个按钮来完成。在模拟器启动并且打包程序已经运行后,调试器将附加到打包程序上。 像这样配置launch.json文件:
  "configurations": [
    {
      "name": "Debug",
      "program": "${workspaceRoot}/.vscode/launchReactNative.js",
      "type": "reactnative",
      "request": "attach",
      "sourceMaps": true,
      "outDir": "${workspaceRoot}/.vscode/.react",
      "port": "8081",
      "address": "localhost",
      "preLaunchTask": "npm: debug:dev"
    },
  ]

package.json 文件中,您只需要添加新的脚本:

  "scripts": {
    "debug:dev": "react-native run-ios --scheme 'My project scheme' --configuration 'Debug' --simulator 'iPhone 8'",

3

除了使用 Chrome 调试 React Native 应用程序外,另一种方法是使用由 Microsoft 在 VS Code 上提供的 React Native Tools 扩展来在 VS Code 本身中调试 React Native 应用程序。

请查看此处以获取详细的所有说明。


0
    { "version": "0.2.0", "configurations": [
{
        "name": "Debug Android",
        "type": "reactnative",
        "request": "launch",
        "platform": "android",
        "sourceMaps": true,
        "cwd": "${workspaceFolder}"
    },
    {
        "name": "Debug iOS",
        "type": "reactnative",
        "request": "launch",
        "platform": "ios",
        "target": "iPhone 11 Pro Max",
        "sourceMaps": true,
        "cwd": "${workspaceFolder}"
    },
    {
        "name": "Debug Attach",
        "type": "reactnative",
        "request": "attach",
        // "platform": "ios",
        // "target": "iPhone 8",
        "sourceMaps": true,
        "cwd": "${workspaceFolder}"
    },
    {
        "name": "Debug Device iOS",
        "type": "reactnative",
        "request": "launch",
        "platform": "ios",
        "target": "device",
        "runArguments": ["--device"],
        "sourceMaps": true,
        "cwd": "${workspaceFolder}"
    }

}


-1
发现使用Chrome可以进行调试、跟踪和断点,尝试了一下,效果很好。

1
实际上,如果您已启用并连接了 Chrome 扩展程序,则调试器将显示另一个调试器正在侦听。您需要禁用 Chrome 扩展程序才能让 VSC 插件连接。 - Eduardo Chongkan

网页内容由stack overflow 提供, 点击上面的
可以查看英文原文,
原文链接