如何在Plotly的两个子图之间共享图例颜色

3
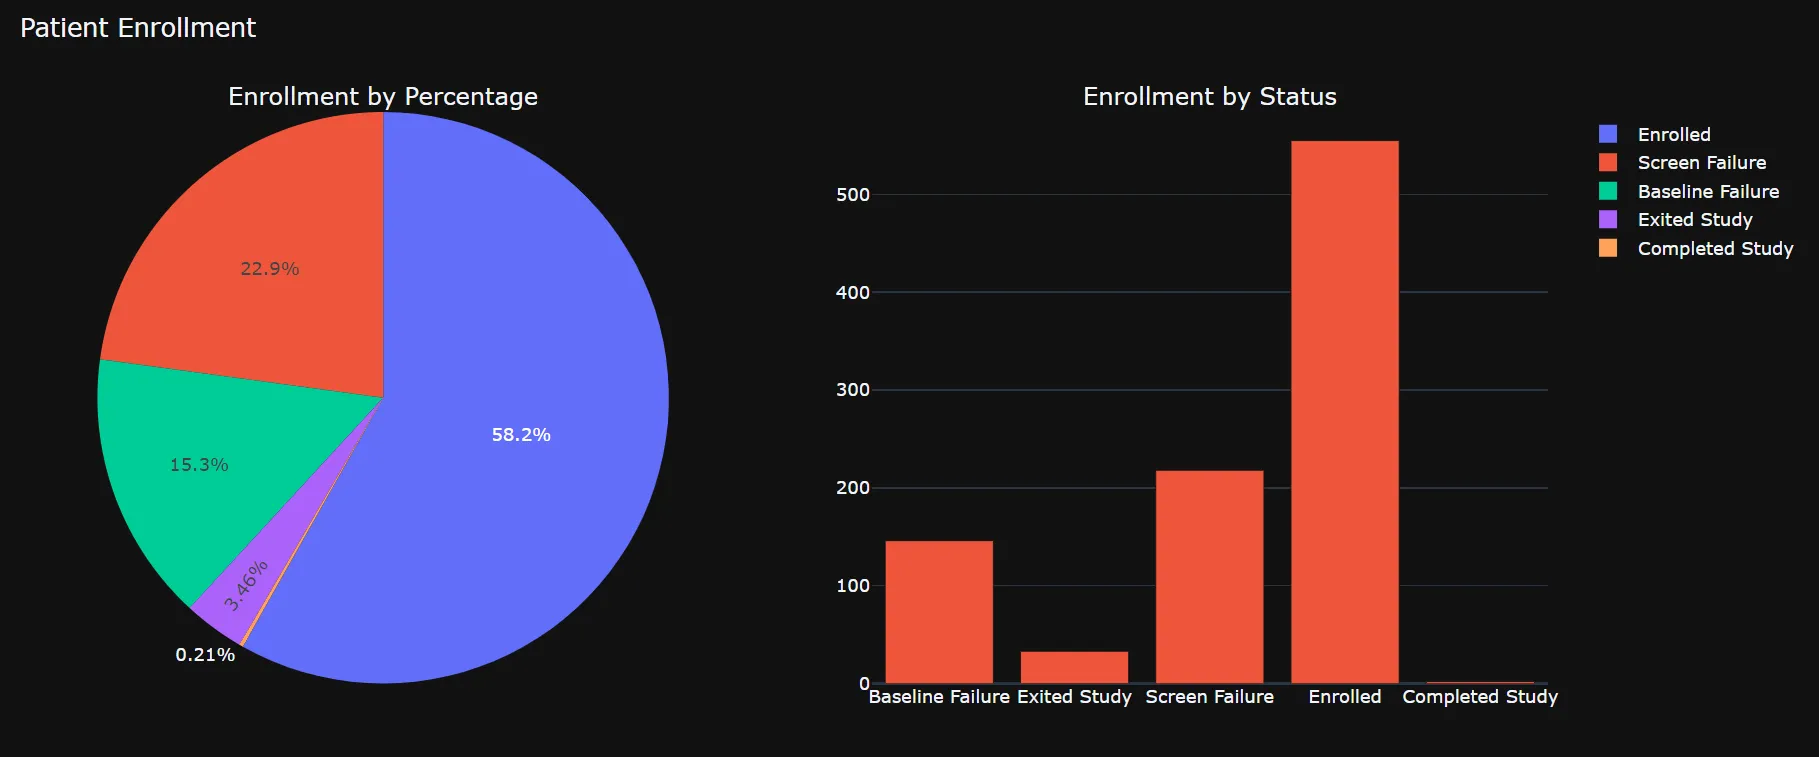
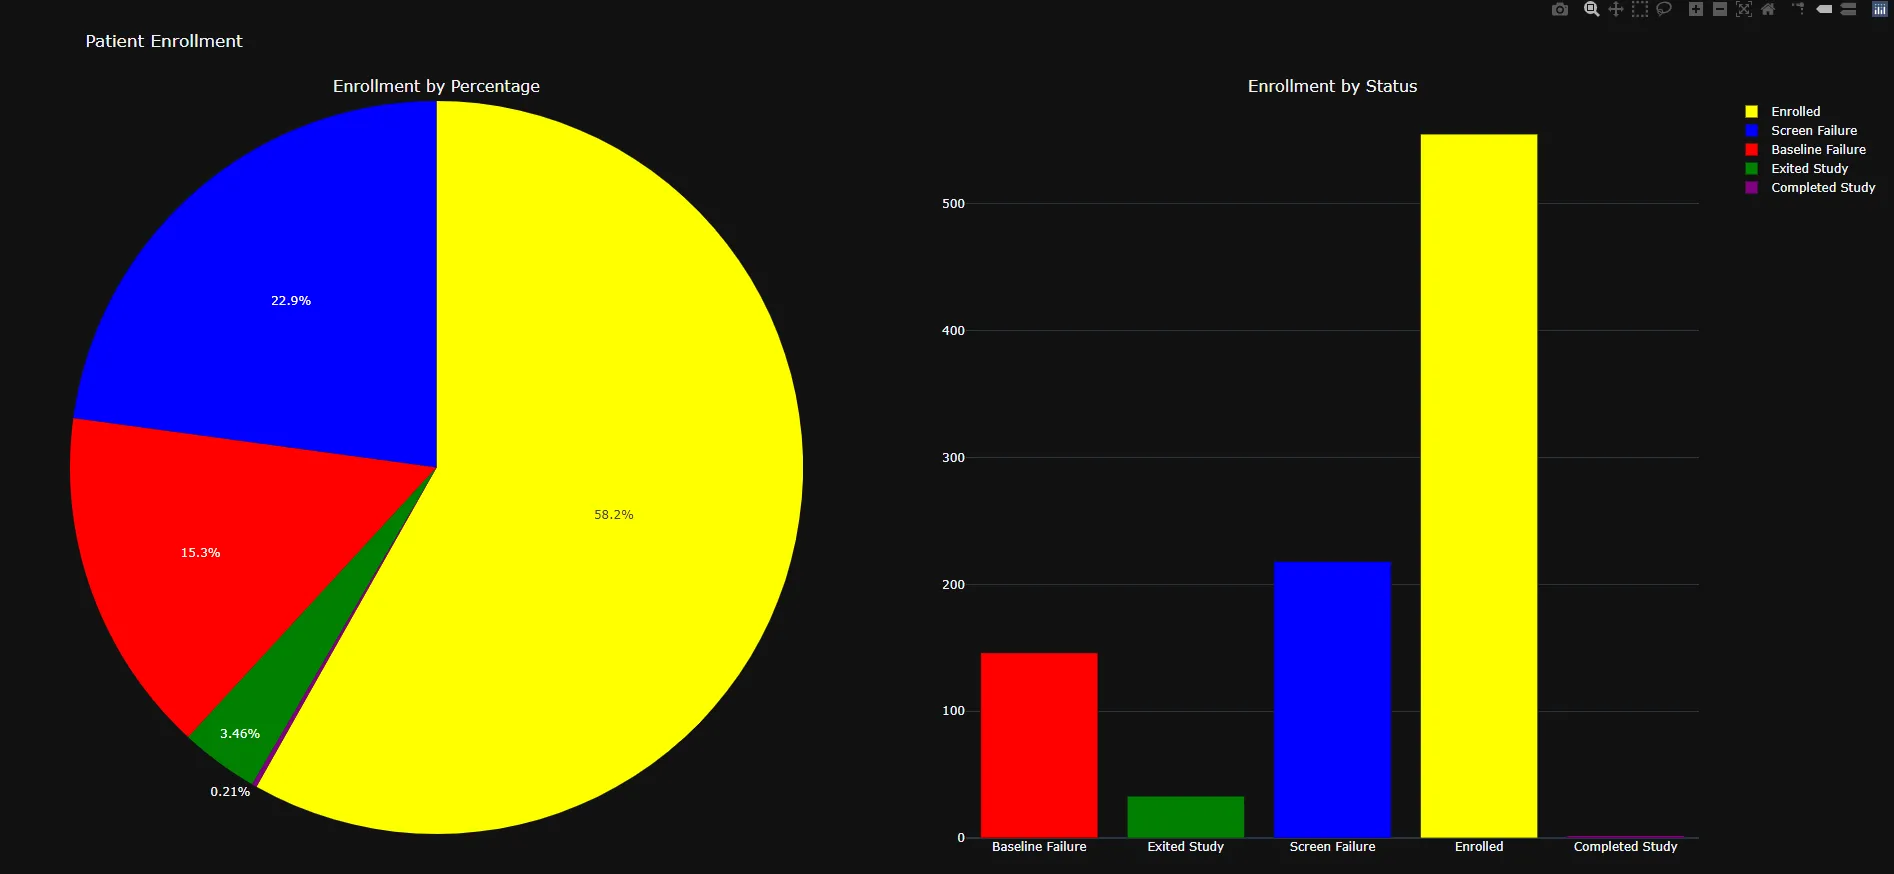
我想让两个子图使用相同的颜色模式,以便更容易地进行可视化。这两个图形使用相同的变量来显示内容。当前图例作为饼图的一部分显示。
我已经勤奋地寻找答案,但似乎无法弄清楚。
import plotly.graph_objects as go
from plotly.subplots import make_subplots

subfig = make_subplots(
    rows=1, cols=2,
    column_widths=[10,10],
    row_heights=[10],
    subplot_titles=("Enrollment by Percentage", "Enrollment by Status"),
    specs=[[{"type": "pie"}, {"type": "bar"}]])

cols = ['Baseline Failure', 'Exited Study', 'Screen Failure', 'Enrolled', 'Completed Study']
count = [146, 33, 218, 555, 2]

subfig.add_trace(go.Pie(labels=cols, values=count, showlegend=True), 1,1)
subfig.add_trace(go.Bar(x=cols, y=count, showlegend=False),1,2)

subfig.update_layout(
    template="plotly_dark", title='Patient Enrollment'
)
subfig.show()

感谢您的帮助。

附加绘图图例

1个回答

2

go.Pie使用marker=dict(colors="..."),而go.Bar使用marker_color="..."

由于您有5个不同的值,因此我们可以创建颜色列表。

colors=['red','green','blue','yellow','purple']

import plotly.graph_objects as go
from plotly.subplots import make_subplots

subfig = make_subplots(
    rows=1, cols=2,
    column_widths=[10,10],
    row_heights=[10],
    subplot_titles=("Enrollment by Percentage", "Enrollment by Status"),
    specs=[[{"type": "pie"}, {"type": "bar"}]])

colors = ['red','green','blue','yellow','purple']  # bar and pie colors

cols = ['Baseline Failure', 'Exited Study', 'Screen Failure', 'Enrolled', 
        'Completed Study']

count = [146, 33, 218, 555, 2]

subfig.add_trace(go.Pie(labels=cols, values=count, marker=dict(colors=colors), 
                 showlegend=True), 1,1)

subfig.add_trace(go.Bar(x=cols, y=count,marker_color=colors, 
                 showlegend=False),1,2)

subfig.update_layout(template="plotly_dark",
                     title='Patient Enrollment')

subfig.show()

example output


网页内容由stack overflow 提供, 点击上面的
可以查看英文原文,
原文链接