从文本文件直接绘制函数

7

有没有一种方法可以根据文本文件中的值绘制函数?

我知道如何在gnuplot中定义一个函数,然后绘制它,但这不是我需要的。 我有一个包含常量的表格,用于更新函数。当更新发生时,我希望能够运行一个脚本来绘制这条新曲线的图像。由于要绘制的图像很少,我想自动化这个过程。

这是一个带有常量的示例表格:

location a  b  c
1        1  3  4
2

我看到有两种方法可以解决这个问题,但我不确定它们是否能够实现。
  1. 我可以使用awk生成字符串:f(x)=1(x)**2+3(x)+4,将其写入文件,并以某种方式使gnuplot读取这个新文件并在特定的x范围内绘图。
  2. 或者在gnuplot中使用awk,例如f(x) = awk /1/ {print "f(x)="$2}等,或者直接在绘图命令中使用awk。
无论哪种情况,我都卡住了,在网上没有找到解决这个问题的方法,你有什么建议吗?

你为什么要寻找一行代码的解决方案? - mgilson
当我使用gnuplot时,我总是从Perl内部调用它。如果由于某种原因这不是一个选项,我建议从gnuplot脚本内部调用awk。请参见此处此处以了解如何实现此操作。 - Steve
我认为问题描述不是很精确,特别是样本文本文件将如何被解释。 - U. Windl
4个回答

3

另一个使此更加通用的可能性是,您可以执行以下操作:

假设参数存储在文件parameters.dat中,第一行包含变量名称,其余所有行都包含参数集,例如:

location a b c
1        1 3 4

脚本文件如下所示:
file = 'parameters.dat'
par_names = system('head -1 '.file)
par_cnt = words(par_names)

# which parameter set to choose
par_line_num = 2
# select the respective string
par_line = system(sprintf('head -%d ', par_line_num).file.' | tail -1')
par_string = ''
do for [i=1:par_cnt] {
  eval(word(par_names, i).' = '.word(par_line, i))
}
f(x) = a*x**2 + b*x + c

plot f(x) title sprintf('location = %d', location)

1
这个问题(如何在Gnuplot中将数据文件中的一个数字存入变量)的第一个答案对我有所帮助。
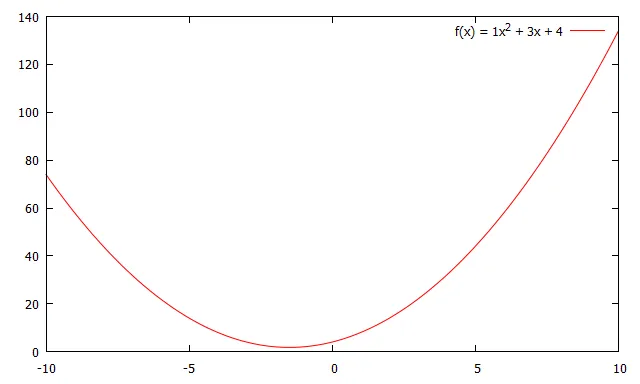
在我的情况下,我有一个包含抛物线参数的文件。我已经将这些参数保存在Gnuplot变量中。然后,我为每个时间步骤绘制包含参数变量的函数。
#!/usr/bin/gnuplot

datafile = "parabola.txt"

set terminal pngcairo size 1000,500
set xrange [-100:100]
set yrange [-100:100]
titletext(timepar, apar, cpar) = sprintf("In timestep %d we have parameter a = %f, parameter c = %f", timepar, apar, cpar)

do for [step=1:400] {
  set output sprintf("parabola%04d.png", step)

  # read parameters from file, where the first line is the header, thus the +1
  a=system("awk '{ if (NR == " . step . "+1) printf \"%f\", $1}' " . datafile)
  c=system("awk '{ if (NR == " . step . "+1) printf \"%f\", $2}' " . datafile)

  # convert parameters to numeric format
  a=a+0.
  c=c+0.

  set title titletext(step, a, c)

  plot   c+a*x**2
}

这将生成一系列名为parabola0001.png、parabola0002.png、parabola0003.png等的png文件,每个文件都显示从名为parabola.txt的文件中读取的参数的抛物线。标题包含给定时间步长的参数。
要理解gnuplot system()函数,您需要知道:
双引号内的内容不会被gnuplot解析;
点用于在gnuplot中连接字符串;
awk printf命令的双引号必须转义,以隐藏它们不被gnuplot解析器解析。
要测试此gnuplot脚本,请将其保存到任意名称的文件中,例如parabolaplot.gplot,并使其可执行(chmad a+x parabolaplot.gplot)。可以使用以下命令创建parabola.txt文件:

0
awk '/1/ {print "plot "$2"*x**2+"$3"*x+"$4}' | gnuplot -persist

将选择该行并绘制它


0
这是/曾经是关于如何使用gnuplot将特定值提取到变量中的另一个问题(也许值得创建一个关于此主题的维基条目)。 无需使用awk,您可以仅使用gnuplot(因此与平台无关),甚至使用gnuplot 4.6.0(2012年3月)。 您可以执行stats(请参阅help stats)并将值分配给变量。

数据:SO15007620_Parameters.txt

location a  b  c
1        1  3  4
2       -1  2  3
3        2  1 -1
脚本:(适用于gnuplot 4.6.0,2012年3月)
### read parameters from separate file into variables
reset

FILE = "SO15007620_Parameters.txt"

myLine = 1     # line index 0-based
stats FILE u (a=$2, b=$3, c=$4) every ::myLine::myLine nooutput

f(x) = a*x**2 + b*x + c

plot f(x) w l lc rgb "red" ti sprintf("f(x) = %gx^2 + %gx + %g", a,b,c)
### end of script

结果:

enter image description here


网页内容由stack overflow 提供, 点击上面的
可以查看英文原文,
原文链接