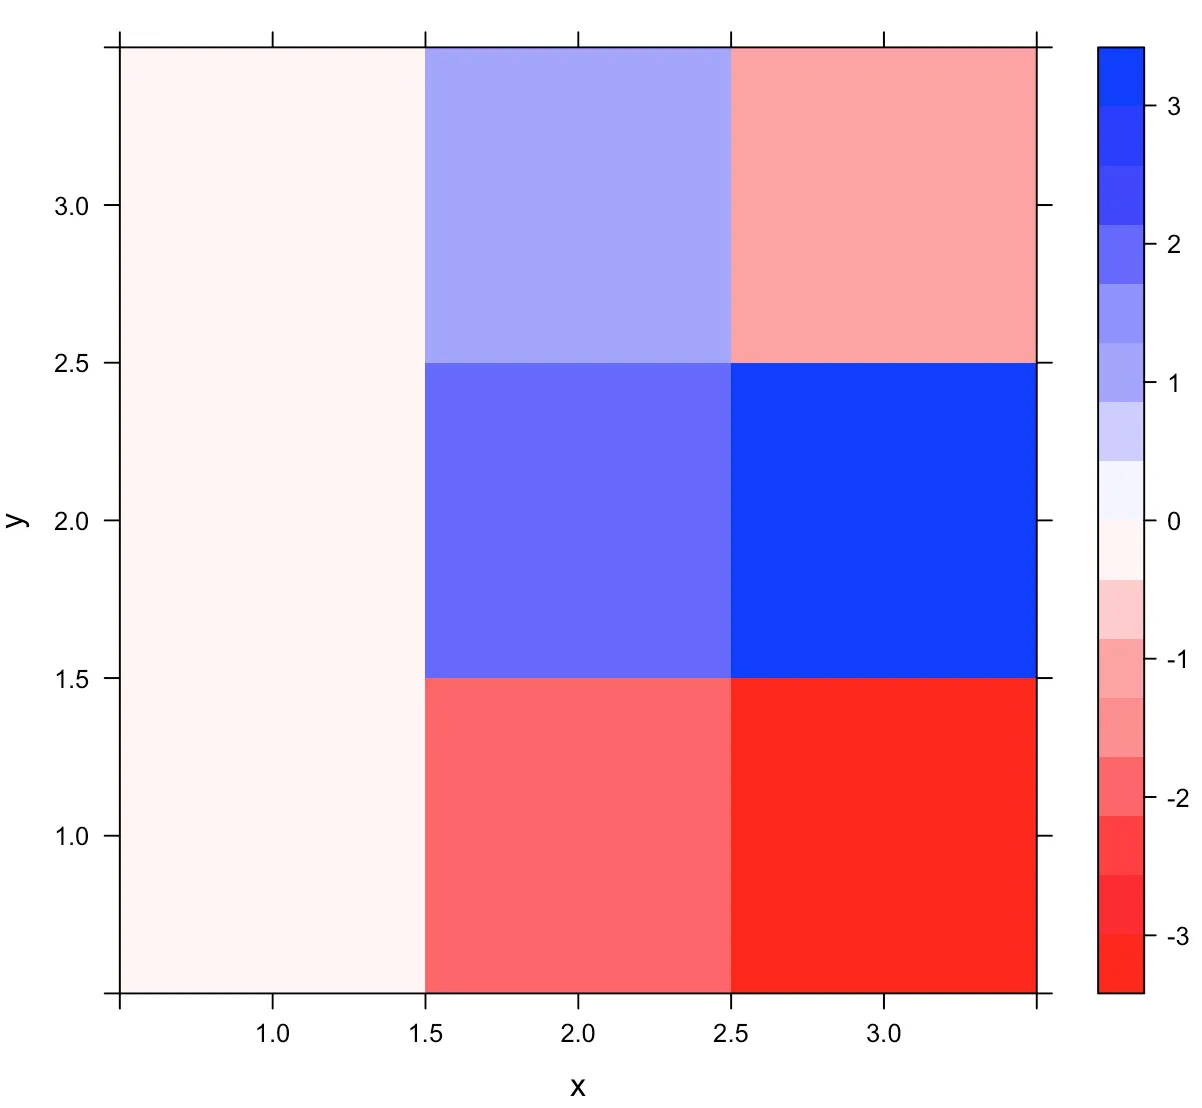
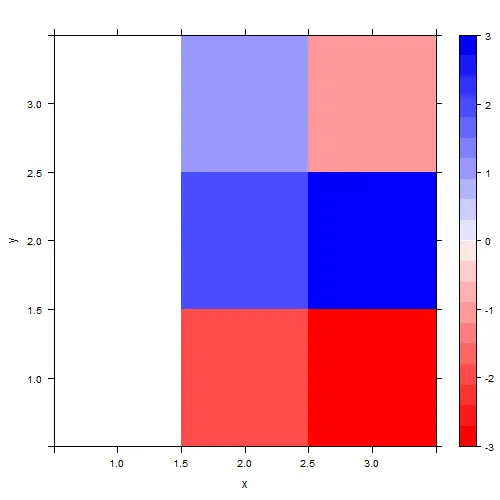
我有以下代码。它生成一个levelplot,其中小于0的方块值应该以红色调着色,大于0的方块值应该以蓝色调着色。然后我想让值为0的正方形变成白色。但是,没有什么东西最终变成了白色。我该如何修复这个问题?
那第一列中的三个正方形都应该是白色的。
library(lattice)

cc = colorRampPalette( c("red", "white","blue"))
trellis.par.set(regions=list(col=cc(20)))
x = c(1,2,3,1,2,3,1,2,3)
y = c(1,1,1,2,2,2,3,3,3)
z = c(0,-2,-3,0,2,3,0,1,-1)
df = data.frame(x,y,z)
p <- levelplot(z~x*y, df,
               panel=function(...) {
                 arg <- list(...)
                 panel.levelplot(...)
                 })
print(p)
更新:
这里有一个可重复的示例,试图修复它,但仍不太正确:
这是一个数据框 df:
    x y           z
1   1 1 -0.17457167
2   2 1  0.93407856
3   3 1  0.55129545
4   4 1  0.97388216
5   5 1 -1.00000000
6   6 1  0.52883410
7   7 1 -1.00000000
8   8 1  0.85112829
9   9 1 -1.00000000
10 10 1  1.00000000
11 11 1 -0.87714166
12 12 1  1.00000000
13 13 1 -0.95403260
14 14 1  1.00000000
15 15 1 -0.91600501
16 16 1  1.00000000
17 17 1 -1.00000000
18 18 1 -0.38800669
19 19 1 -0.52110322
20 20 1  0.00000000
21 21 1 -0.08211450
22 22 1  0.55390723
23 23 1  1.00000000
24 24 1 -0.04147514
25 25 1 -1.00000000
26 26 1 -0.39751358
27 27 1 -0.99550773
28 28 1  0.00000000
29 29 1  0.20737568
30 30 1  0.00000000
31 31 1  0.00000000
32 32 1  0.00000000
33 33 1 -0.26702883
接下来是代码:
cc = colorRampPalette( c("red", "white","blue"))
trellis.par.set(regions=list(col=cc(21)))
zrng <- range(z)       # what's the range of z
tol <- 1e-2            # what tolerance is necessary?
colorBreaks <- c(
  seq(zrng[1] - 0.01, 0 - tol, length.out = 11),
  seq(0 + tol,zrng[2] + 0.01,length.out = 10))
p <- levelplot(z~x*y, df,
               at = colorBreaks,
               panel=function(...) {
                 arg <- list(...)
                 panel.levelplot(...)
               })
print(p)
它生成了这个图,但是光谱中没有白色的插槽:
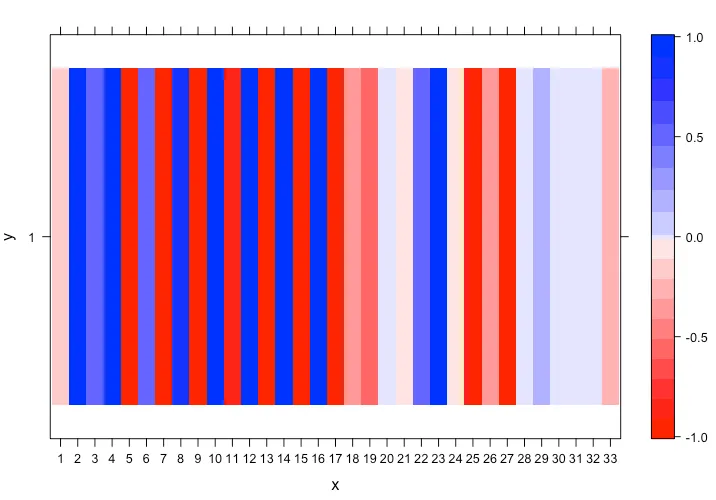
which(cc(20)=="#FFFFFF"),你需要分别从红色到白色和从白色到蓝色进行两个单独的颜色渐变。 - thelatemail