使用Python 3.5.2和Folium 0.3.0。
我尝试创建自定义弹出窗口,每当我点击具有数据的特定国家时它们就会出现。我设法让弹出窗口出现了,但我在动态传递值方面感到迷失。我熟悉Python,但是对JSON等新手。
我从一个Series对象final_dict开始。接下来,我有一个国家多边形数据集countries_reduced.json。根据此处找到的示例,我修改folium.GeoJson模板以在鼠标悬停在具有数据的国家上时进行突出显示,并在单击该国家时显示弹出窗口。弹出窗口本身显示得很好,但到目前为止,我只能通过代码行将一些来自final_dict的值(例如final_dict [0])传递给所有国家。
var html_aaa = $('<div id="html_aaa" style="width: 100.0%; height: 100.0%;">"""+ "{0:.2f}%".format(final_dict[0] * 100) + """</div>')[0];
在下面的代码片段中,例如如图所示(这里),美国的弹出窗口显示为
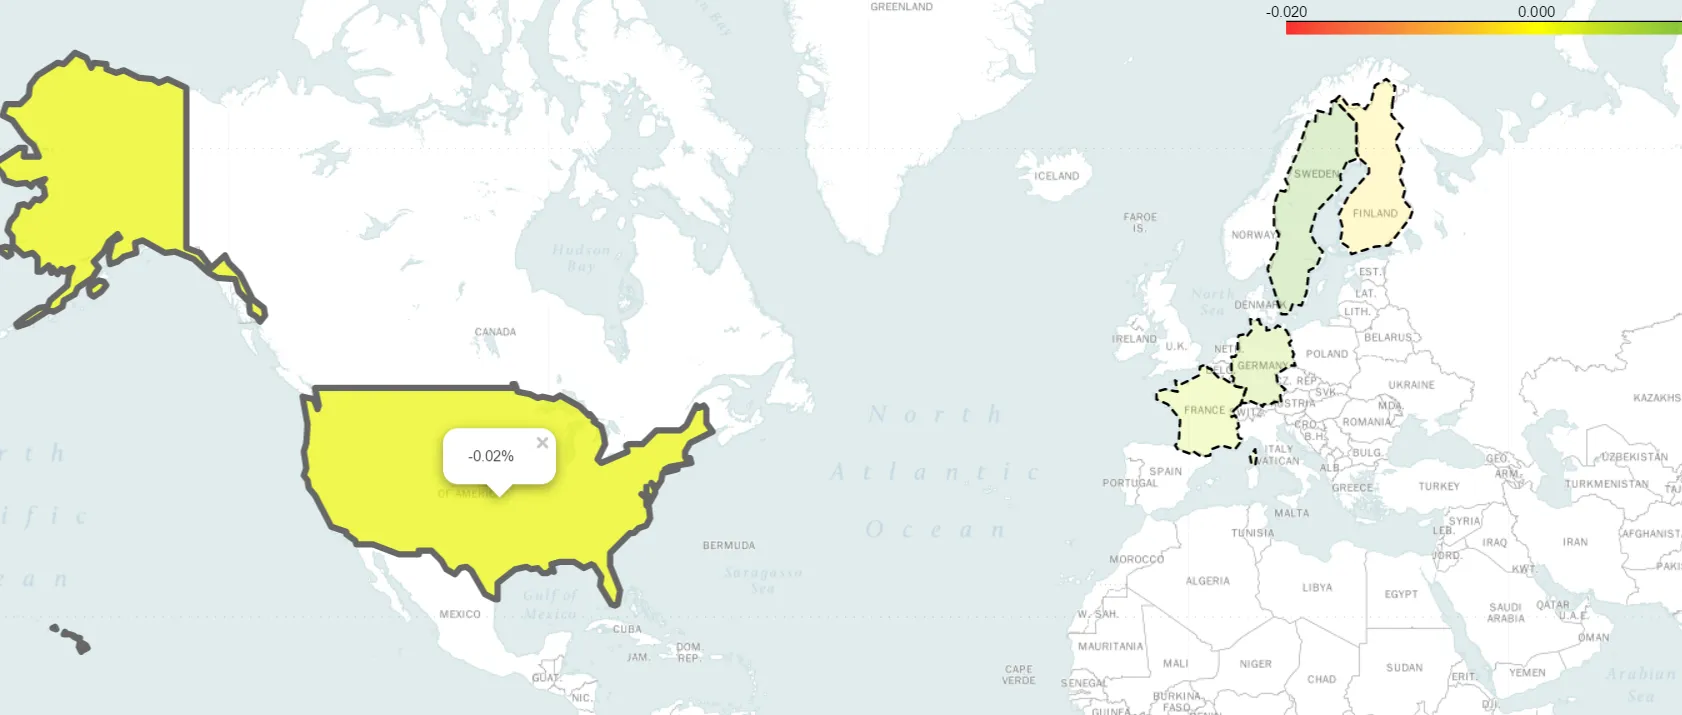
-0.02%,但实际应该为0.18%。
有什么想法可以动态地将与所单击的国家对应的值传递到弹出窗口中吗?
我的代码如下:import pandas as pd
import numpy as np
# Data
array = np.array([-0.000247 , 0.00178 , -0.0183 , 0.00831 , 0.0135 , -0.00266 , 0.00461])
final_dict = pd.Series(array, index=['JPN', 'USA', 'ARG', 'DEU', 'SWE', 'FIN' , 'FRA'])
# Create map
import json
import folium
geo_json_data = json.load(open('countries_reduced.json'))
linear = folium.LinearColormap(['red','yellow','green'], vmin=-0.02, vmax=0.02)
linear.to_step(21)
m = folium.Map([0,0], tiles='Mapbox Bright', zoom_start=2)
g = folium.GeoJson(
geo_json_data,
style_function=lambda feature: {
'fillColor': linear(final_dict[feature['id']]),
'color' : 'black',
'weight' : 2,
'dashArray' : '5, 5'
},
).add_to(m)
# Following example provided here: https://github.com/python-visualization/folium/issues/341,
# I overwrite the g_Template
from jinja2 import Template
g._template = Template("""
{% macro script(this, kwargs) %}
var {{this.get_name()}} = {};
var popup_aaa = L.popup({maxWidth: '300'});
var html_aaa = $('<div id="html_aaa" style="width: 100.0%; height: 100.0%;">"""+ "{0:.2f}%".format(final_dict[0] * 100) + """</div>')[0];
popup_aaa.setContent(html_aaa);
{{this.get_name()}}.style = function(feature) {return feature.properties.style;};
{{this.get_name()}}.highlightStyle = function(feature) {return {
weight: 5,
color: '#666',
dashArray: '',
fillOpacity: 0.7
};
};
{{this.get_name()}}.onEachFeature = function onEachFeature(feature, layer) {
layer.on({
mouseover: function(e) {
e.target.setStyle({{this.get_name()}}.highlightStyle(e.target.feature));
e.target.bindPopup(popup_aaa);},
mouseout: function(e) {
{{this.get_name()}}.geoJson.resetStyle(e.target);
}
});
};
{{this.get_name()}}.geoJson = L.geoJson(
{% if this.embed %}{{this.style_data()}}{% else %}"{{this.data}}"{% endif %},{
style : {{this.get_name()}}.style,
onEachFeature: {{this.get_name()}}.onEachFeature
})
.addTo({{this._parent.get_name()}});
{% endmacro %}
""")
# And draw the map with additions, save
m.add_child(g)
m.add_child(linear)
m.save('map4.html')