根据不同数据集中的值,格式化闪亮数据表(DT)的颜色

10

我正在尝试根据前面表格中的值来格式化DT。例如,我想显示某个事物是增加、减少还是保持不变。我可以使用kable来实现这一点,但是在我想要单击一个单元格并在另一个DT中显示与该值相关的所有数据的下一步时无法成功。

library(shiny)
library(DT)
library(dplyr)
ui <- fluidPage(
    mainPanel(
      dataTableOutput("iris_head")
  )
)

server <- function(input, output) {

  #df_data <- iris

  df_data <- head(iris[-5])

  # Just a dataset describing if iris has changed over a month
  # If reference data is of the same size as the original data (df_data). 
  # If reference data is negative I want the cell in the df_data to be green; 
  # If zero blue and if positive then green.
  # I can make changes with ranges within the current range, can we get the color encoding from another table?
  # set the seed
  set.seed(42)
  reference_df <-  (sapply(df_data, function(x) jitter(x, amount = 2)) - df_data) %>% 
    round(. , digits = 0) 

  print(reference_df)


  output$iris_head <- renderDataTable(datatable(df_data, selection = "single" )%>%
                                        formatStyle('Sepal.Width',
                                                    color = styleInterval(c(3.4, 3.8), c('green', 'blue', 'red')),
                                                    backgroundColor = styleInterval(3.4, c('gray', 'yellow'))) %>%
                                        formatString('Sepal.Width', suffix = '<font color="red">&uArr; </font>'))


}

shinyApp(ui = ui, server = server)

这种情况下的reference_df是:

Sepal.Length Sepal.Width Petal.Length Petal.Width
        2           1            2           0
        2          -1           -1           0
       -1           1            0           2
        1           1            2          -1
        1           0            2           2
        0           1           -2           2

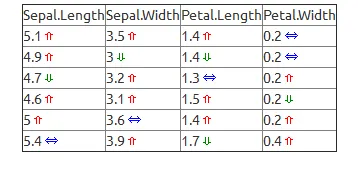
所需输出如图所示,在其中我也想根据参考数据框中的值对文本和背景进行着色,如下图。

enter image description here

1个回答

12

对于文本颜色部分,你可以使用 formatStyle,但需要将 df_datareference_df 进行 cbind,然后将其传递给 datatable,并根据第 5 列到第 8 列的值更改第 1 到第 4 列的样式:

datatable(cbind(df_data,reference_df), selection = "single",
                                                options=list(columnDefs = list(list(visible=FALSE, targets=c(5:8)))))%>%
                                        formatStyle(1:4, valueColumns=5:8,
                                                    color = JS("value < 0 ? 'red' : value > 0 ? 'green' : 'blue'"))

columnDefs部分隐藏了最后4列。

如果您想添加箭头,则无法根据值格式化字符串,因此您可以在将其传递给datatable之前修改df_data以添加颜色和箭头:

  for(col in 1:dim(df_data)[2]){
    df_data[col] <- mapply(function(i,j){
      ifelse(i > 0, paste0("<span style='color:red'>",j,"<font>&uArr; </font></span>"),
             ifelse(i<0, paste0("<span style='color:green'>",j,"<font>&dArr; </font></span>"),
                    paste0("<span style='color:blue'>",j,"<font>&hArr; </font></span>")))
    },reference_df[col],df_data[col])
  }

  output$iris_head <- renderDataTable(
    datatable(df_data, selection = "single",escape = F)
    )

这段代码循环遍历df_data的值,并根据reference_df的值对其进行更改。您需要在datatable调用中使用escape=F参数来防止HTML转义。

如果您想着色背景等,可以在span标签中添加更多CSS样式。


谢谢您提供的非常清晰明了的答案。有点奇怪,有人在没有评论的情况下对这个问题进行了负评,考虑到它已经得到了如此好的回答。 - discipulus

网页内容由stack overflow 提供, 点击上面的
可以查看英文原文,
原文链接