我有一个使用以下代码生成的
这是生成的图形: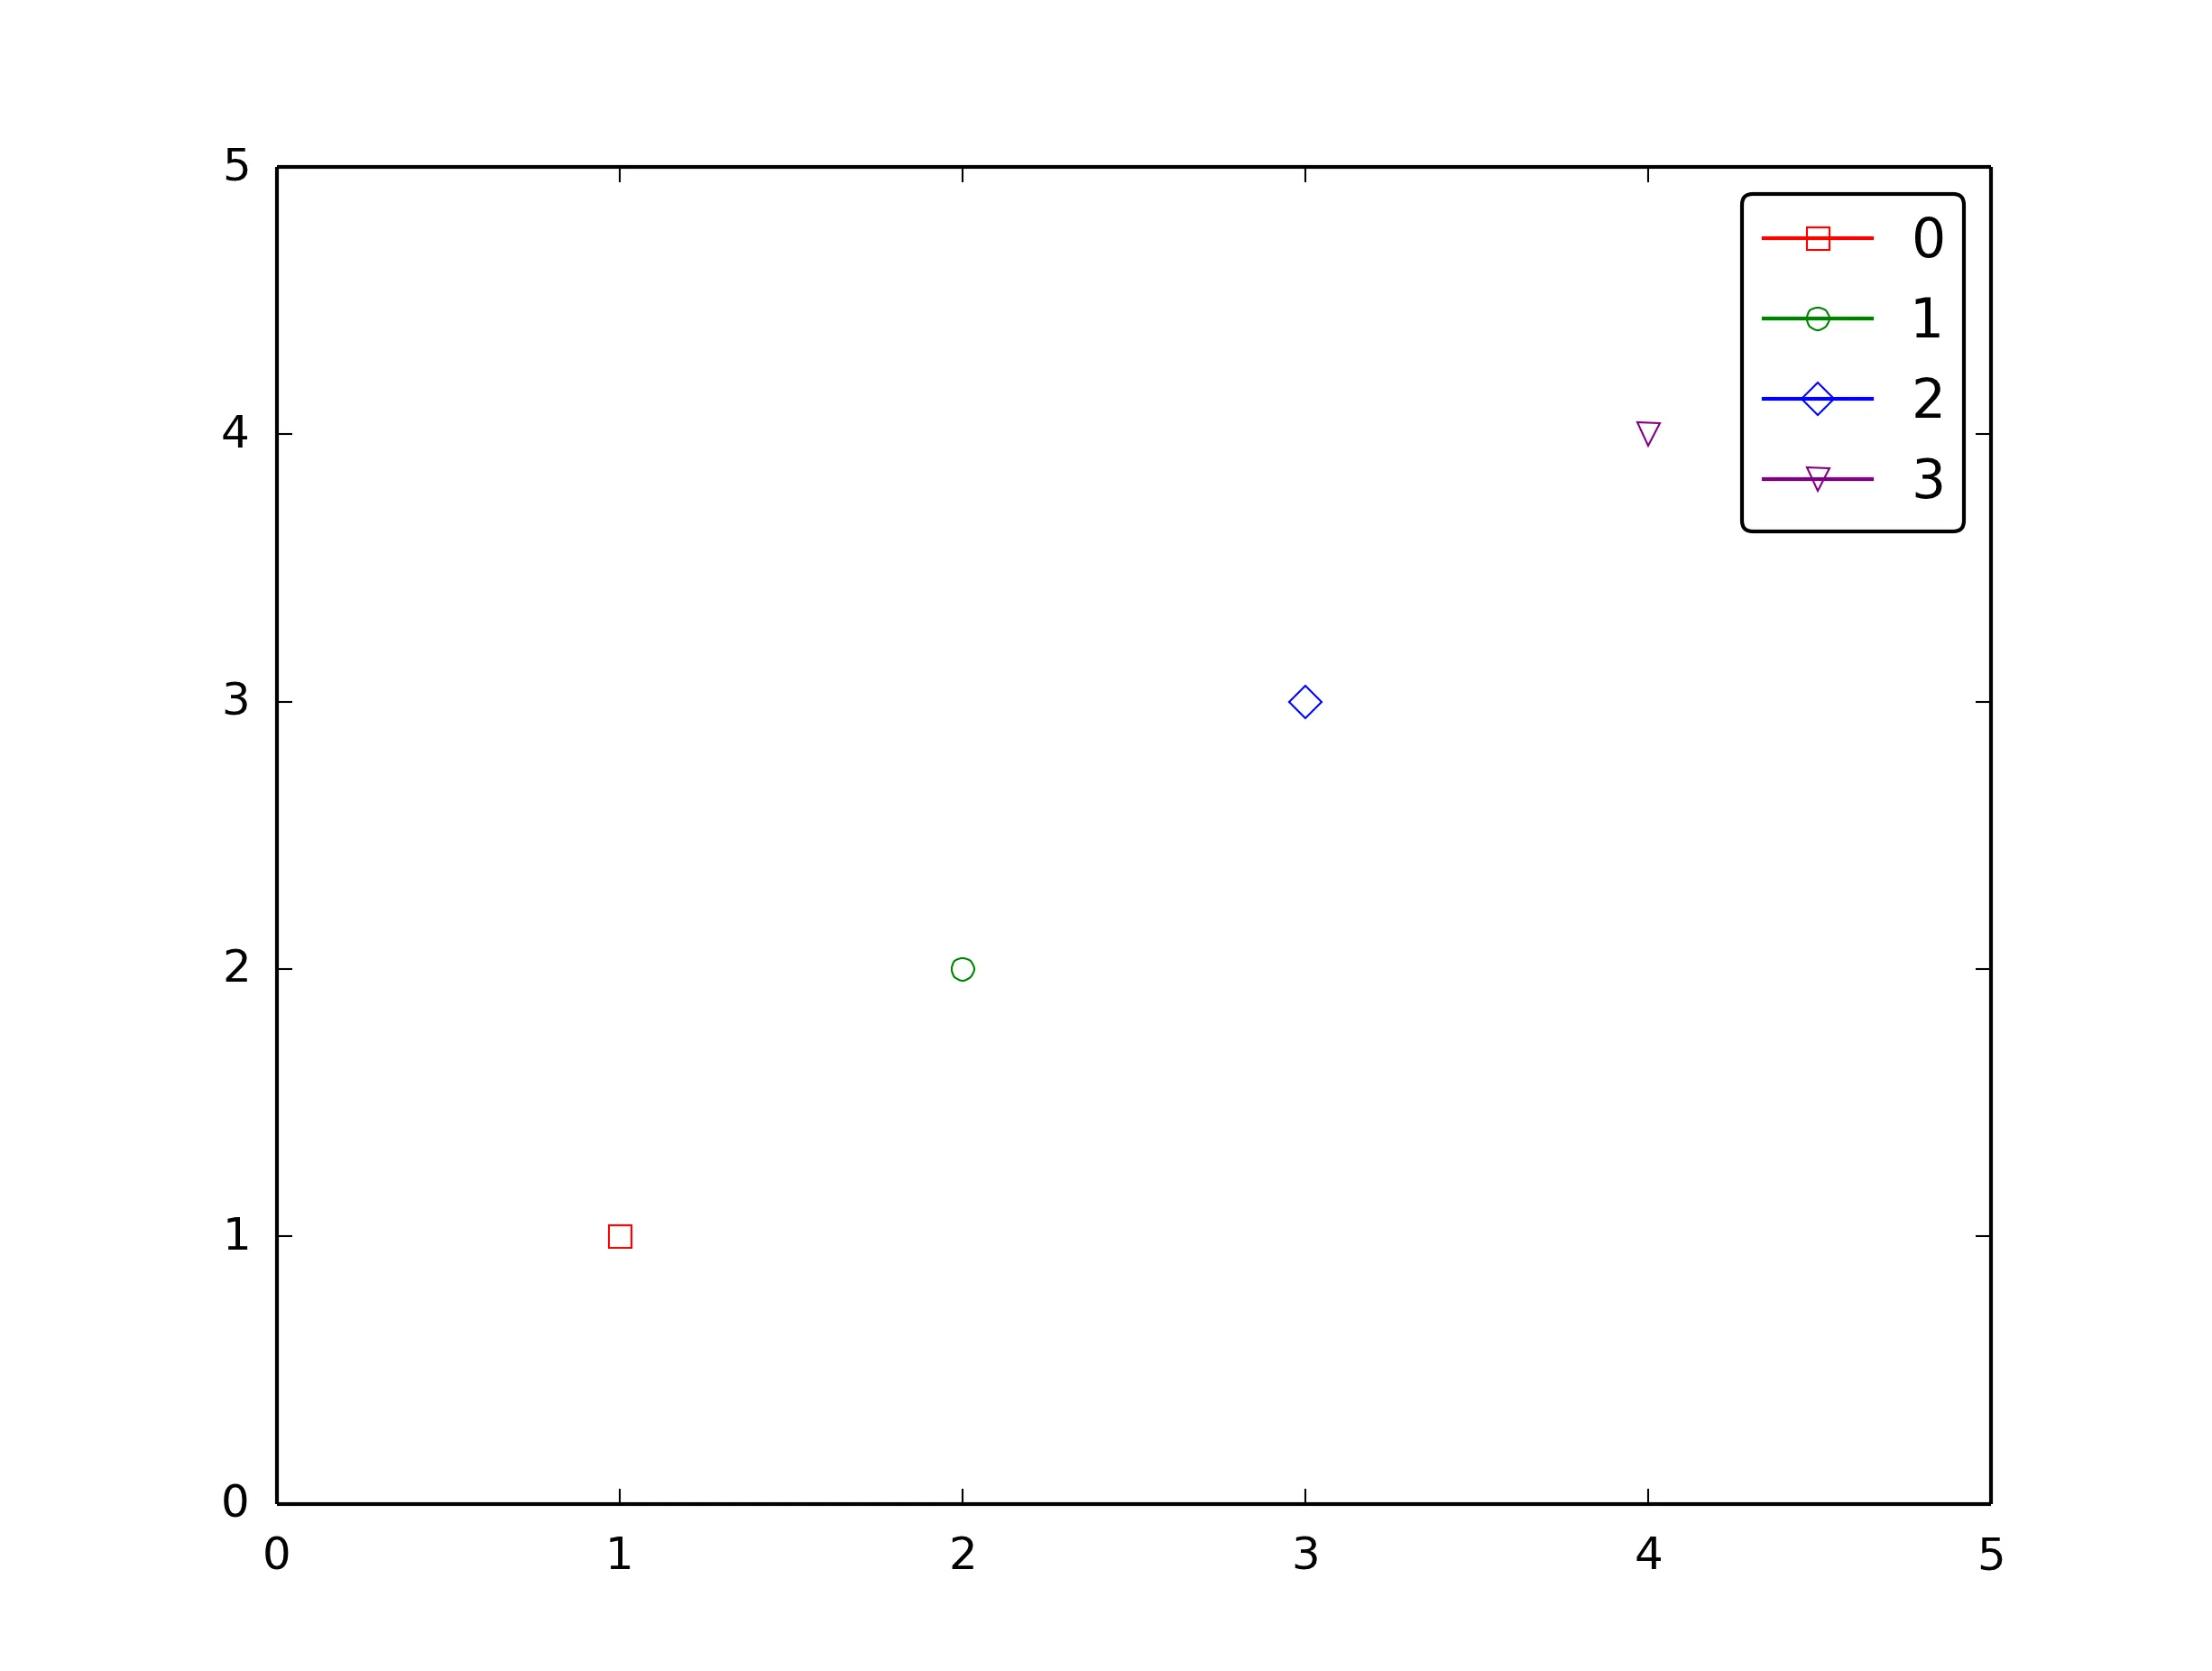 我不喜欢图例中的标记线。我该如何去掉它们?
matplotlib图表:import matplotlib.pyplot as pyplot
Fig, ax = pyplot.subplots()
for i, (mark, color) in enumerate(zip(
['s', 'o', 'D', 'v'], ['r', 'g', 'b', 'purple'])):
ax.plot(i+1, i+1, color=color,
marker=mark,
markerfacecolor='None',
markeredgecolor=color,
label=i)
ax.set_xlim(0,5)
ax.set_ylim(0,5)
ax.legend()
这是生成的图形:
我不喜欢图例中的标记线。我该如何去掉它们?
handletextpad=-.5, columnspacing=0, borderpad=-.5, borderaxespad=0等,包括可以用作关键字参数的handlelength。 - tom10None而是"None"。 - bonobols=' '。 - Stardust