如何编写标记具有矩形的蜡烛图形态的MQL4代码(EA)

14

我对写 mql4 代码很新,如果能帮助我在出现以下蜡烛图模式时绘制矩形,我将不胜感激:

FIG1:

来自 https://imgur.com/a/fRoPzsm 的图片

Run code snippet

<blockquote class="imgur-embed-pub" lang="en" data-id="a/fRoPzsm"><a href="//imgur.com/a/fRoPzsm">Demand Zone 1</a></blockquote><script async src="//s.imgur.com/min/embed.js" charset="utf-8"></script>

图2:

来自 https://imgur.com/a/4E8KE1R 的图片

运行代码片段

<blockquote class="imgur-embed-pub" lang="en" data-id="a/4E8KE1R" data-context="false"><a href="//imgur.com/a/4E8KE1R">Demand Zone 2</a></blockquote><script async src="//s.imgur.com/min/embed.js" charset="utf-8"></script>

以及

图3:

来自 https://imgur.com/a/h6D6o6R 的图片

运行代码片段

<blockquote class="imgur-embed-pub" lang="en" data-id="a/h6D6o6R"><a href="//imgur.com/a/h6D6o6R">Hidden Demand Zone</a></blockquote><script async src="//s.imgur.com/min/embed.js" charset="utf-8"></script>

并且相应的供应区域,以及使用指定点数的止损和盈利订单。

很抱歉我没有直接包含图片。我没有足够的Upvotes来这样做。

这里是链接图片中蜡烛图形态的解释:

需求区

一般的蜡烛图形态(需求区)发生在至少两个或更多连续的看涨蜡烛(最后一个看涨蜡烛的高点是该时间段的高点)后,跟随着一个或多个高低都比最后一个看涨蜡烛低的看跌蜡烛。最后再跟着一个形成新高的看涨蜡烛。需求区域被限定为从最后一个看跌蜡烛的开盘到最低点的矩形区域。

隐蔽需求区

当一系列连续的看涨蜡烛中有一根蜡烛其最低点低于前一根蜡烛,而其高点与收盘价重合时,则隐蔽需求区被定义为从该看涨蜡烛的最低点到其开盘价。

完整的解释可以在这里找到,包括需求区和供应区。

我知道看涨和看跌蜡烛可以通过


    if ( ( Open[1] - Close[1] ) > 0)
    {
      // candle is bearish
    }
    else
    {
      // candle is bullish
    }

我非常希望能得到帮助。


1
那么你是在请求别人为你编写代码来查找这些模式吗? - Michel_T.
我需要帮助编写代码来查找模式。 - TopLeft
1
SO不是提供代码的地方。如果您有确切的问题,这里的人们会很乐意帮助您,但“为我完成任务”-这是一个错误的请求,我怀疑没有人会免费为您完成这个请求。 - Michel_T.
3
@JosephLee 我并没有发起悬赏,但从问题的回答情况来看,我相信除了很多人从解决方案中受益外,该解决方案还将产生多个赞,甚至可能比悬赏本身更多。这只是基于我在这里所见过的一点点经验的个人看法。 - TopLeft
2
@JosephLee 我同意TopLeft所说的。赏金似乎需要很多东西,但是通过一个好的答案也可以得到很多东西。此外,为了将事情放在透视中,我没有提出这个问题,但由于我对解决方案的兴趣,我已经付出了接近于我的声誉值三分之一的代价。 - OnlyCodeMatters
显示剩余2条评论
2个回答

1
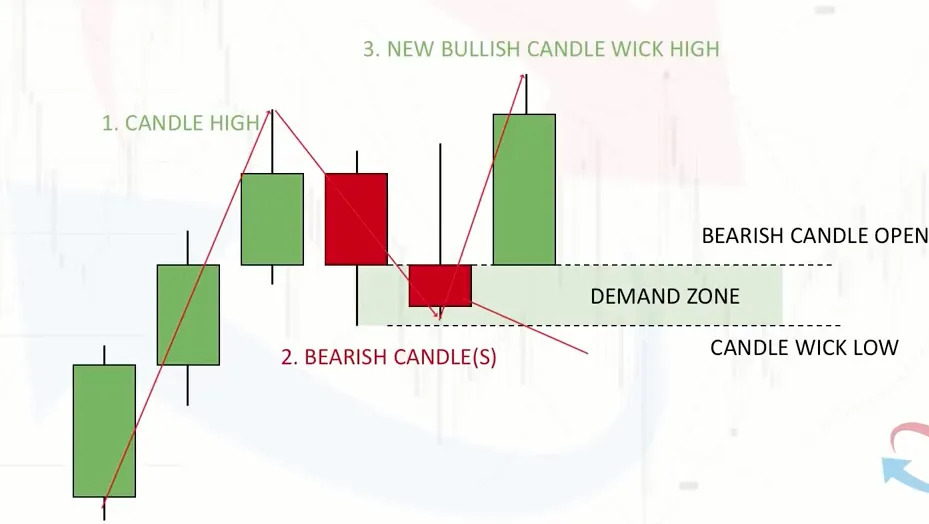
似乎这些模式没有完全描述清楚,因此无法正确编码。好的,让我们尝试使用模式#1。 用于模式(从图片中看起来合理的条件):
1. 在新的柱子(bar#0)开始时检查。
2. 柱子1(如果我们将0计算为当前值,则为MQL4中的bar#3)必须是看涨的。
3. 柱子2(bar#2)是看跌的。(或者在模式#2的情况下是N个柱子,N可以是2个或更多) 4. 柱子3(MT4中的bar#1)是看涨的。
5. 它的高=收盘价。
6. 它的高>柱#3的高。
enum EnmDir
 {
  LONG = 1,
  SHORT=-1,
  NONE = 0,
 };
int getCandleDirection(const int shift)
{
   const double open=iOpen(_Symbol,0,shift), close=iClose(_Symbol,0,shift);
   if(close-open>_Point/2.)
      return LONG;      //bullish
   if(open-close>_Point/2.)
      return SHORT;     //bearish
   return NONE;     //doji
}
bool isPattern1Detected(const EnmDir dir)
{
   if(dir==0)return(false);
   if(getCandleDirection(3)!=dir)
      return false; //rule#2
   if(getCandleDirection(2)+dir!=0)
      return false; //rule#3
   if(getCandleDirection(1)!=dir)
      return false; //rule#4
   if(dir>0)
   {
      if(iHigh(_Symbol,0,1)-iClose(_Symbol,0,1)>_Point/2.)
         return false;  //rule#5 for long
      if(iHigh(_Symbol,0,1)-iHigh(_Symbol,0,3)>_Point/2.)
         return true;   //rule#6 for long
      return false;     //if rule#6 is not hold
   }
   else
   {
      if(iClose(_Symbol,0,1)-iLow(_Symbol,0,1)>_Point/2.)
         return false;  //rule#5 for short
      if(iLow(_Symbol,0,3)-iLow(_Symbol,0,1)>_Point/2.)
         return true;   //rule#6 for short
      return false;     //if rule#6 is not hold
   }
}
bool isPattern2Detected(const EnmDir dir,const int numCandlesAgainst=1)
{
   if(dir==NONE)return(false);
   if(getCandleDirection(1)!=dir)
      return false; //rule#4
   for(int i=1;i<=numCandlesAgainst;i++)
   {
      if(getCandleDirection(1+i)!=dir)
         return(false); //rule#3 - checking that all numCandlesAgainst must be bearish
   }
   if(getCandleDirection(2+numCandlesAgainst)!=dir)
       return false; //rule#2
   if(dir>0)
   {
     if(iHigh(_Symbol,0,1)-iClose(_Symbol,0,1)>_Point/2.)
        return false;  //rule#5 for long
     if(iHigh(_Symbol,0,1)-iHigh(_Symbol,0,2+numCandlesAgainst)>_Point/2.)
        return true;   //rule#6 for long
     return false;     //if rule#6 is not hold
   }
   else
   {
     if(iClose(_Symbol,0,1)-iLow(_Symbol,0,1)>_Point/2.)
        return false;  //rule#5 for short
     if(iLow(_Symbol,0,2+numCandlesAgainst)-iLow(_Symbol,0,1)>_Point/2.)
        return true;   //rule#6 for short
     return false;     //if rule#6 is not hold
   }
}

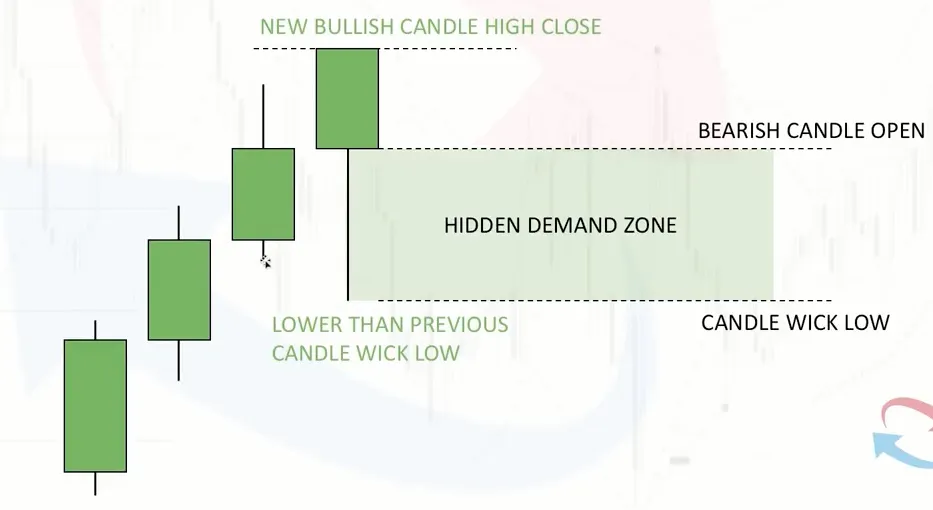
还需要什么?要检测矩形的HL吗?这很简单,规则很清晰。让我们假设它们是:对于LONG,up=第2根K线的开盘价,down=该K线的最低价。然后,

void detectRangeOfZone(double &top,double &bottom,const EnmDir dir)
{
    if(dir>0)
    {
        top=iOpen(_Symbol,0,2);
        bottom=iLow(_Symbol,0,2);
    }
    else if(dir<0)
    {
        top=iClose(_Symbol,0,2);
        bottom=iHigh(_Symbol,0,2);
    }
}

你需要画一个矩形吗?好的,但是你如何决定停止绘制的时间呢?假设向右N个条形图足够了,现在先忽略周末(如果考虑到市场关闭的周末会更加复杂)。

bool drawRectangle(const int dir,const double top,const double bottom)
{
    const datetime starts=iTime(_Symbol,0,2), ends=starts+PeriodSeconds()*N_bars;//time of start and end of the rectangle
    const string name=prefix+"_"+(dir>0?"DEMAND":"SUPPLY")+"_"+TimeToString(starts);//name would be unique sinse we use time of start of the range. DO NOT FORGET about prefix - it should be declared globally, you would be able to delete all the objects with 'ObjectsDeleteAll()' function that accepts prefix in one of its implementations.

    if(!ObjectCreate(0,name,OBJ_RECTANGLE,0,0,0,0,0))
    {
        printf("%i %s: failed to create %s. error=%d",__LINE__,__FILE__,name,_LastError);
        return false;
    }
    ObjectSetInteger(0,name,OBJPROP_TIME1,starts);
    ObjectSetInteger(0,name,OBJPROP_TIME2,ends);
    ObjectSetDouble(0,name,OBJPROP_PRICE1,top);
    ObjectSetDouble(0,name,OBJPROP_PRICE2,bottom);
    //add color, width, filling color, access modifiers etc, example is here https://docs.mql4.com/ru/constants/objectconstants/enum_object/obj_rectangle
    return true;
}

这是主要的代码块,请不要忘记添加新的检查条,否则工具将在每个时间片检查对象,这是浪费时间。 string prefix=""; //为所有对象添加一些唯一的前缀 const int N_bars = 15; //本例中有15个条形图

void OnDeinit(const int reason){ObjectsDeleteAll(0,prefix);}
void OnTick()
{
    if(!isNewBar())
        return;     //not necessary but waste of time to check every second

    const bool pattern1Up=isPattern1Detected(1), pattern1Dn=isPattern1Detected(-1);
    if(pattern1Up)
    {
        double top,bottom;
        detectRangeOfZone(top,bottom,1);
        drawRectangle(1,top,bottom);
        PlacePendingOrder(1,top,bottom);
    }
    if(pattern1Dn)
    {
        double top,bottom;
        detectRangeOfZone(top,bottom,-1);
        drawRectangle(-1,top,bottom);
        PlacePendingOrder(-1,top,bottom);
    }
}

int PlacePendingOrder(const EnmDir dir,const double oop,const double suggestedSl)
{
   const double lot=0.10;                  //FOR EXAMPLE, PUT YOUR DATA HERE
   const string comment="example for SOF";
   const int magicNumber=123456789;

   int cmd=dir>0 ? OP_BUY : OP_SELL;
   double price=(dir>0 ? Ask : Bid), spread=(Ask-Bid);
   if(dir*(oop-price)>spread)
      cmd+=(OP_BUYSTOP-OP_BUY);
   else if(dir*(price-oop)>spread)
      cmd+=(OP_BUYLIMIT-OP_BUY);

   int attempt=0, ATTEMPTS=5, SLEEP=25, SLIPPAGE=10, result=-1, error=-1;
   while(attempt<ATTEMPTS)
     {
      attempt++;
      RefreshRates();
      if(cmd<=OP_SELL)
        {
         price=dir>0 ? Ask : Bid;
         result=OrderSend(_Symbol,cmd,lot,price,SLIPPAGE,0,0,comment,magicNumber);
        }
      else
        {
         result=OrderSend(_Symbol,cmd,lot,oop,SLIPPAGE,0,0,comment,magicNumber);
        }
      if(result>0)
         break;
      error=_LastError;
      Sleep(SLEEP);
    }
  if(result>0)
    {
     if(OrderSelect(result,SELECT_BY_TICKET))
       {
        price=OrderOpenPrice();
        if(!OrderModify(result,price,suggestedSl,0,OrderExpiration()))
           printf("%i %s: failed to modify %d. error=%d",__LINE__,__FILE__,result,_LastError);
           //tp is zero, sl is suggested SL, put yours when needed
       }
     return result;
    }
    printf("%i %s: failed to place %s at %.5f. error=%d",__LINE__,__FILE__,EnumToString((ENUM_ORDER_TYPE)cmd),(cmd>OP_SELL ? oop : price),error);
    return -1;
}

因此,我们感兴趣的是一组熊市蜡烛中的最后一个熊市蜡烛。它的开盘价和最低价构成需求区域。隐藏的需求区域由至少两个看涨蜡烛组成,其高点高于前一个蜡烛的高点,低点低于前一个蜡烛的低点。开盘价和最低价形成了隐藏的需求区域。我想展示N_bars的矩形是可以的。如果您能提供一个完整的示例,包括在识别出该模式时设置挂单、止损和盈利目标,我将不胜感激。 - TopLeft
2
@DanielKniaz 要获得这个问题的赏金,您需要补充一些内容,例如基于上述图像的更通用的模式识别器。我已经按照TopLeft的建议观看了视频的前几分钟,它们描述得很清楚。此外,还需要缺失的带有挂单示例的测试代码。 - OnlyCodeMatters
@OnlyCodeMatters,所有的模式都不同。好的,模式#1和模式#2很相似,我添加了一个实现#2的代码(与#1非常相似)。对于#3-它与#1或#2不同,并且在您或TS检查并理解识别模式#1的所有步骤后,编写它将非常容易。添加了挂单示例,实现isNewBar()函数后代码将编译(在MQL5.com上的文章或任何其他实现中,或隐藏该块)。 - Daniel Kniaz
@DanielKniaz 我有一段时间没来了,刚想起我创建了一个悬赏 :). 我还没有能够检查你编写的代码,并且在悬赏结束之前也没有时间。但是从一瞥和你所付出的努力来看,我猜测你的答案最接近所需的解决方案。 - OnlyCodeMatters
@TopLeft 设置对象颜色等的代码甚至可能无法编译。请展示完整代码。即使isNewBar()看起来在MT4中也应该能够使用,但它来自于MT5。 - Daniel Kniaz
显示剩余14条评论

1

我迟到了 :'( 工作让我无法访问StackOverflow :'( 无论如何,我不能按照悬赏要求提供完整的程序,也无法提供解决此需求区问题的完整代码。

但是,我仍然想为每个人提供一些“起点”,以便在MT4(MQL4)上构建自己的模式识别器。

为了使文本简短,我录制了一个YouTube视频来描述它。 https://youtu.be/WSiyY52QyBI

无论如何,以下是代码:

//+------------------------------------------------------------------+
//|                                                   SO56854700.mq4 |
//|                 Copyright 2019, Joseph Lee, TELEGRAM JosephLee74 |
//|               https://stackoverflow.com/users/1245195/joseph-lee |
//+------------------------------------------------------------------+
#property copyright "Copyright 2019, Joseph Lee, TELEGRAM JosephLee74"
#property link      "https://stackoverflow.com/users/1245195/joseph-lee"
#property version   "1.00"
#property strict

#include <clsBar.mqh>
#include <stderror.mqh> 
#include <stdlib.mqh> 

//==========================================================================

//-------------------------------------------------------------------
// System Variables
//-------------------------------------------------------------------
double  viPipsToPrice               = 0.0001;
double  viPipsToPoint               = 1;
string  vsDisplay                   = "";

//-------------------------------------------------------------------

//+------------------------------------------------------------------+
//| Expert initialization function                                   |
//+------------------------------------------------------------------+
int OnInit() {
    ObjectsDeleteAll(); Comment("");
    // Caclulate PipsToPrice & PipsToPoints (old sytle, but works)
    if((Digits == 2) || (Digits == 3)) {viPipsToPrice=0.01;}
    if((Digits == 3) || (Digits == 5)) {viPipsToPoint=10;}

    return(INIT_SUCCEEDED);
}


//+------------------------------------------------------------------+
//| Expert deinitialization function                                 |
//+------------------------------------------------------------------+
void OnDeinit(const int reason) {
    ObjectsDeleteAll();
    return(0);
}


//+------------------------------------------------------------------+
//| Expert tick function                                             |
//+------------------------------------------------------------------+
void OnTick() {
    if(!isNewBar())
        return;

    clsCandlestickPattern   voPatterns[];
    clsPatternRecognizer        voRec(Symbol(), true), PERIOD_CURRENT, 0);
    voRec.sbRecognizePatterns(voPatterns);
    for(...
       Display the content with Comment() ...
}
//+------------------------------------------------------------------+

更重要的是,clsBar.mqh。请注意,这是一个“包含文件”,应位于include文件夹中。包含文件有助于使我们的程序更加简洁,帮助我们编写可重用代码。在编写OOP类时非常有用。
clsBar.mqh:下载(OneDrive)https://1drv.ms/u/s!AoLFy6fRYNsvjTU-xSzAADCwGjPQ
不幸的是,该文件太大无法包含在此帖子中。因此,我必须将其上传到OneDrive。

1
@JospehLee,clsBar.mqh 看起来确实可以让事情变得简单很多。我按照你的要求将文件放在了 include 文件夹中,并尝试运行了你提供的示例,只在 OnTick() 中使用了 clsCandlestickPattern voPatterns[];,但是我遇到了几个 fniGetLargerOffniGetSmallerOffniGetPricePerPip 的错误。如果您能提供一个完整的示例,例如在识别到看跌吞没模式时,在看跌蜡烛的开盘价和收盘价上绘制两条水平线,那就太好了。这将真正说明应该如何使用 clsBar.mqh - TopLeft
我也尝试使用 clsBar.mqh,但遇到了类似的问题。 - TenOutOfTen

网页内容由stack overflow 提供, 点击上面的
可以查看英文原文,
原文链接