我运行了以下代码来创建一个矩形轮廓:
#import the necessary packages
import argparse
import imutils
import cv2
import numpy as np
# construct the argument parse and parse the arguments
ap = argparse.ArgumentParser()
ap.add_argument("-i", "--image", required=True,
help="path to the input image")
args = vars(ap.parse_args())
# load the image, convert it to grayscale, blur it slightly, and threshold it
image = cv2.imread(args["image"])
gray = cv2.cvtColor(image, cv2.COLOR_BGR2GRAY)
gray = cv2.GaussianBlur(gray, (5, 5), 0)
# threshold the image, then perform a series of erosions + dilations to remove any small regions of noise
thresh = cv2.threshold(gray, 45, 255, cv2.THRESH_BINARY)[1]
thresh = cv2.erode(thresh, None, iterations=2)
thresh = cv2.dilate(thresh, None, iterations=2)
contours, hierarchy = cv2.findContours(thresh,cv2.RETR_TREE,cv2.CHAIN_APPROX_SIMPLE)
# Find the index of the largest contour
areas = [cv2.contourArea(c) for c in contours]
max_index = np.argmax(areas)
cnt=contours[max_index]
x,y,w,h = cv2.boundingRect(cnt)
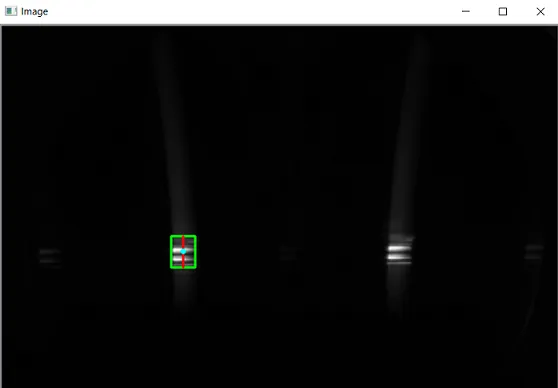
cv2.rectangle(image,(x,y),(x+w,y+h),(0,255,0),2)
# show the output image
cv2.imshow("Image", image)
cv2.waitKey(0)
我想找到矩形轮廓的中心线和中心点,请指教。最初的回答:无需解释。