我在Stack Overflow搜索,谷歌搜索,并阅读了?pdf文档,但是没有找到将绘图保存为pdf并在pdf查看器边缘上切换打开和关闭的层的可能性。我所说的一个例子是可以下载多个层的pdf文件,例如美国地质调查局的四角拓扑地图,如this(压缩的pdf文件)。
pdf()帮助文件中的以下句子听起来很不祥,但我也想确认一下是否我误解了它:
 The R graphics model does not distinguish graphics objects at the level
 of the driver interface.
我曾经可以在Illustrator中保存分层的PDF文件,但现在无法使用这个程序。也许有人能想到一个从R内部解决的方法吗?我用来绘制地图的数据很大,但这里有一个玩具示例:
pdf("2objects.pdf")
plot(NULL, type = "n",xlim = c(0,1),ylim = c(0,1))
rect(0,.7,.7,0,border = "blue",lwd=2)
rect(.3,1,1,.3,border = "red",lty=2,lwd=2)
dev.off()
看起来是这样的(它是一个png,但上面的内容将给出一个pdf)
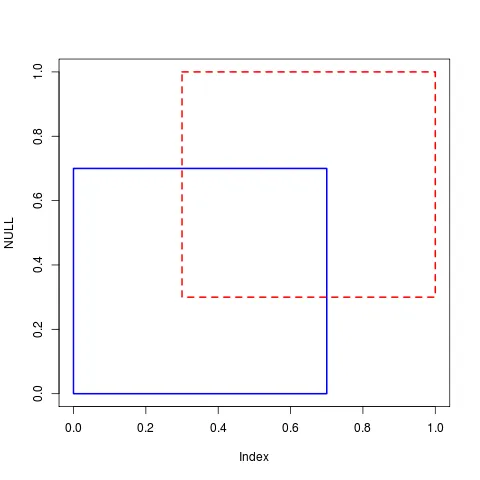 我希望能够将红色和蓝色框作为图层,并在pdf查看器中可以切换其可见性。
非常感谢!
编辑:找到R-help中的线程(关于@mnel),似乎不可能。 我仍然会保留这个问题,以防有人想出了一个巧妙的R解决方法。
编辑(2012年9月5日):我尝试使用Sweave来实现这一点,并通过here发布的解决方法部分成功。该方法生成一个单独的PDF文件,其中包含可以使用图像下方的超链接文本打开和关闭的“层”。它使用“动画”技巧来实现。虽然它仍不是我最终想要的结果,但它具有不依赖于特定PDF查看器的优点。我仍然会等待看看是否有人发布了在Sweave文档中执行层,即OCG的方法,然后我就可以自动化。
编辑(2012年9月13日):我将我的进展作为答案发布,使用上述代码。我能够在更复杂的现实情况下将其工作,而不需要对叠加的不同行政和统计边界进行任何修改。在这种情况下,我只是将不同的地图覆盖命名为layer-0.pdf,layer-1.pdf等,它可以正常工作。我仍然希望这里最终会出现更好的东西。
感谢您的评论
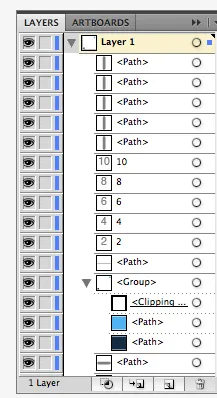
tikzDevice并且可以配置tikz或pgf以提供带有图层的pdf,则可能能够使其正常工作。不幸的是,该软件包已存档,但它确实可以生成美丽的图形(至少在我两年前使用它时是这样的)。 - mnel