在Shiny中叠加两个ggplot图层

3
我有一个非常大的数据集,使用ggplot在Shiny上绘制。我将滑动条与x轴的值相连,希望通过它重新着色选择的子集数据,而其他数据保持不变。
最简单的方法是重新创建整个图表,但由于数据集很大,这是一个非常缓慢的过程。作为替代方案,我考虑让原始图保持不变,并在其上放置另一个图,其中plot.background = 'none',只有着色点。但我无法在server.r中的renderPlotui.r中的plotOutput中实现此目标。 server.r:
output$Plot1= renderPlot({
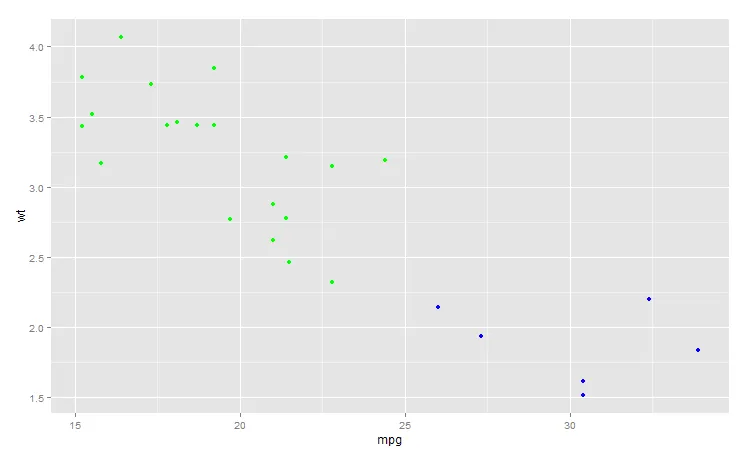
   ggplot(mtcars) + geom_point(aes(x = mpg, y = wt))
})

output$Plot2= renderPlot({
       ggplot(mtcars[mtcars$mpg > 15,]) + geom_point(aes(x = mpg, y = wt), color = 'Efficient')
})

ui.r(我不知道如何将Plot2适配到这里):

fluidRow(
               class = 'Plot1Row',
               column(
                  plotOutput(
                     "Plot1", 
                     width = '100%'
                  ),
                  width = 12
               )
            )

有什么技巧吗?


可能用网格函数修改图表会是更好的主意。(请提供一个可重现的例子...) - Roland
你可以告诉我网格功能在哪里吗?与此同时,我正在添加一个玩具图表。 - TheComeOnMan
你是否考虑使用 ggvis 作为一个选项? - tonytonov
我确实尝试过,但由于ggvis仍在开发中,我不想将自己局限于它。 - TheComeOnMan
你解决了吗?相关新帖子:https://stackoverflow.com/questions/55201041/shiny-reactive-only-for-one-part-of-a-plot-only - zx8754
1个回答

1
这是一个关于我的评论的例子,保留了HTML标记。
library(ggplot2)
p <- ggplot(mtcars[mtcars$mpg > 15,]) + geom_point(aes(x = mpg, y = wt), color = 'green')
p    

#produce an otherwise identical gtable with a subset of points with different color 
p1 <- ggplot(mtcars[mtcars$mpg > 15,]) + geom_blank(aes(x = mpg, y = wt), color = 'green') +
  geom_point(data = mtcars[mtcars$mpg > 25,], aes(x = mpg, y = wt), color = 'blue')
g1 <- ggplot_gtable(ggplot_build(p1))

library(gtable)
#find the correct viewport
seekViewport(grid.grep("panel", grep = TRUE)$name)
#draw just the points 
grid.draw(gtable_filter(g1, "panel")$grobs[[1]]$children$geom_point.points)

resulting plot

这不会重新绘制完整的图表。因为我不是shiny用户,你需要自己测试如何在shiny中实现此操作。

这是在与显示器进行特定的交互,并在其上添加另一层,对吗?这不是修改绘图本身吧? - TheComeOnMan
我不知道你所说的“plot itself”具体是什么意思。如果你想要移除某些东西,你需要重新绘制这个图表(至少我认为是这样的。我对于grid包并不是很专业)。 - Roland
谢谢,@Roland。我会检查一下这个在Shiny上是否可行(虽然我认为可能性不大)。如果可以的话,那么接受的勾选标记就归你了。 - TheComeOnMan

网页内容由stack overflow 提供, 点击上面的
可以查看英文原文,
原文链接