gnuplot中x轴的值

5

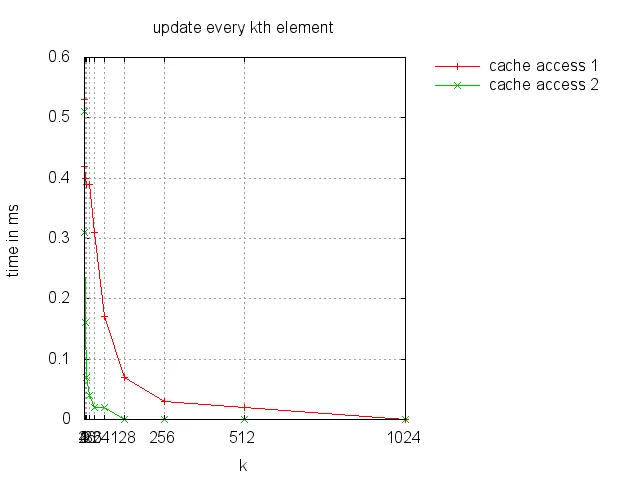
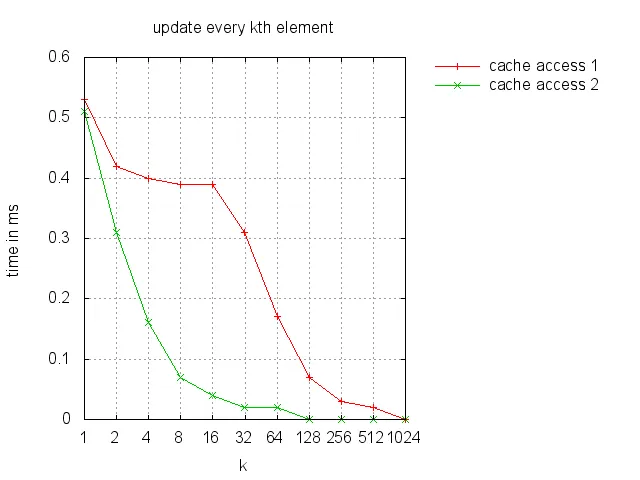
我正在尝试使用gnuplot。我的数据集看起来像这样。

1     0.530000  0.510000
2     0.420000  0.310000
4     0.400000  0.160000
8     0.390000  0.070000
16    0.390000  0.040000
32    0.310000  0.020000
64    0.170000  0.020000
128   0.070000  0.000000
256   0.030000  0.000000
512   0.020000  0.000000
1024  0.000000  0.000000

我的gnuplot文件如下所示。

#!/usr/bin/gnuplot
reset
set terminal png

set ylabel "time in ms"

set xlabel "k"

set title "update every kth element"
set key reverse Left outside
set grid

set style data linespoints

set output 'cache_access.png'
plot "time_mem_access.dat" using 1:2 title "cache access 1", \
      ""                   using 1:3 title "cache access 2"

我得到的图表如下所示。

enter image description here

我的问题是我希望x轴显示第一列的确切值。
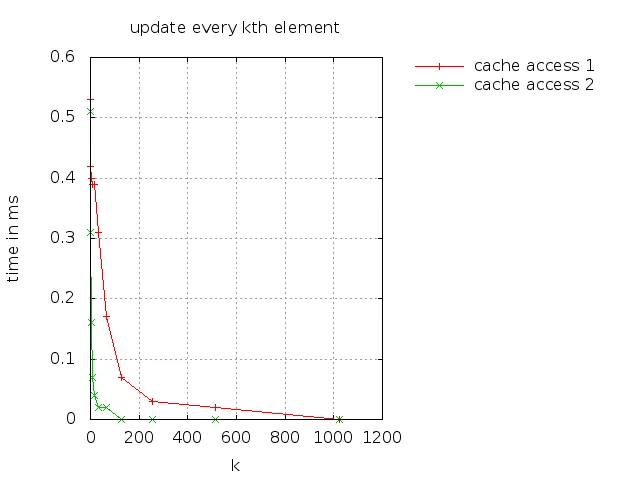
i.e 1,2,4,8,16,32,64 etc.

我在网上找不到任何关于如何精确完成此操作的文档。

1个回答

15

改为调用:

plot "time_mem_access.dat" using 1:2 title "cache access 1", \
      ""                   using 1:3 title "cache access 2"

您可以尝试:

plot "time_mem_access.dat" using 1:2:xtic(1) title "cache access 1", \
      ""                   using 1:3:xtic(1) title "cache access 2"

这将为您提供以下绘图: 在此输入图片描述

然而,您可能想对x值取对数:

plot "time_mem_access.dat" using (log($1)):2:xtic(1) title "cache access 1", \
      ""                   using (log($1)):3:xtic(1) title "cache access 2"

这将给你:

输入图像描述

网页内容由stack overflow 提供, 点击上面的
可以查看英文原文,
原文链接