我想用beamer+sweave制作有关ggplot2图形的演示文稿。有些幻灯片应该有两列:左边一列是代码,右边一列是生成的图形。这是我尝试过的:
\documentclass[xcolor=dvipsnames]{beamer}
\usepackage{/Library/Frameworks/R.framework/Resources/share/texmf/tex/latex/Sweave}
\usepackage[english]{babel}
\usepackage{tikz}
\usepackage{amsmath,amssymb}% AMS standards
\usepackage{listings}
\usetheme{Madrid}
\usecolortheme{dove}
\usecolortheme{rose}
\SweaveOpts{pdf=TRUE, echo=FALSE, fig=FALSE, eps=FALSE, tidy=T, width=4, height=4}
\title{Reproducible data analysis with \texttt{ggplot2} \& \texttt{R}}
\subtitle{subtitle}
\author{Baptiste Augui\'e}
\date{\today}
\institute{Here}
\begin{document}
\begin{frame}[fragile]
\frametitle{Some text to show the space taken by the title}
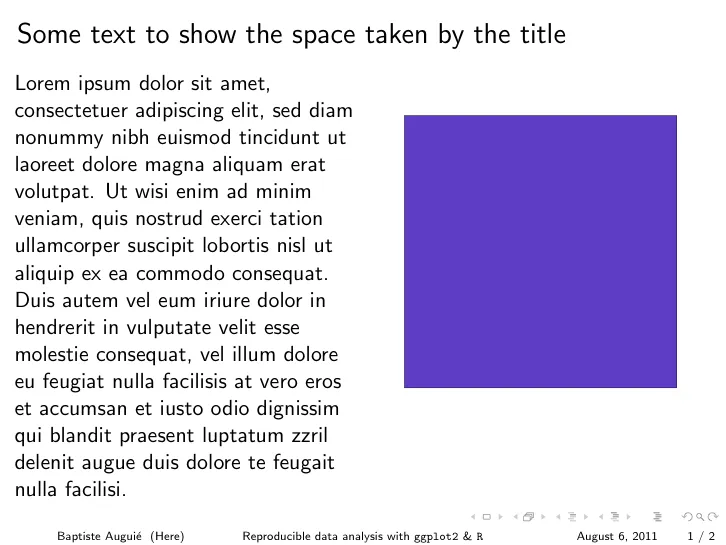
\begin{columns}[t] \column{0.5\textwidth}
Lorem ipsum dolor sit amet, consectetuer adipiscing elit, sed diam nonummy nibh euismod tincidunt ut laoreet dolore magna aliquam erat volutpat. Ut wisi enim ad minim veniam, quis nostrud exerci tation ullamcorper suscipit lobortis nisl ut aliquip ex ea commodo consequat. Duis autem vel eum iriure dolor in hendrerit in vulputate velit esse molestie consequat, vel illum dolore eu feugiat nulla facilisis at vero eros et accumsan et iusto odio dignissim qui blandit praesent luptatum zzril delenit augue duis dolore te feugait nulla facilisi.
\column{0.5\textwidth}
\begin{figure}[!ht]
\centering
<<fig=TRUE>>=
grid.rect(gp=gpar(fill="slateblue"))
@
\end{figure}
\end{columns}
\end{frame}
\begin{frame}[fragile]
\frametitle{Some text to show the space taken by the title}
\begin{columns}[t]
\column{0.5\textwidth}
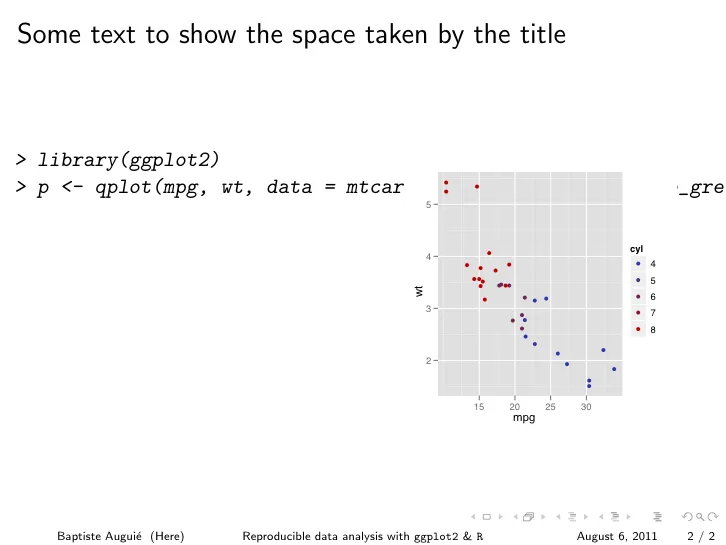
<<echo=TRUE,fig=FALSE>>=
library(ggplot2)
p <-
qplot(mpg, wt, data=mtcars, colour=cyl) +
theme_grey(base_family="Helvetica")
@
\column{0.5\textwidth}
\begin{figure}[!ht]
\centering
<<fig=TRUE>>=
print(p)
@
\end{figure}
\end{columns}
\end{frame}
\end{document}
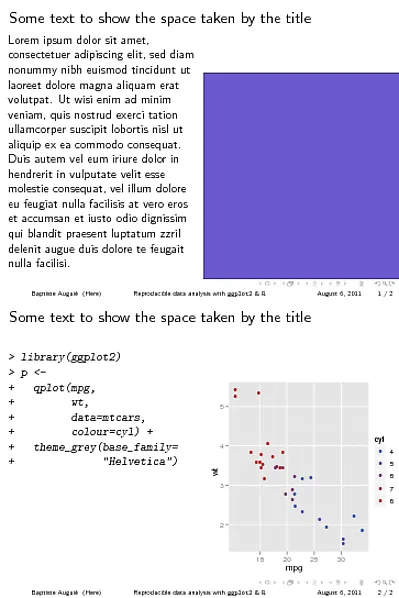
以下是输出的两个页面。
我对这个输出有两个问题:
echo-ed sweave 代码忽略了列环境并跨越了两列
任何一个图形的列边距都不必要地宽
有什么想法吗?
谢谢。