如何使用JavaScript canvas最简单地为透明PNG图像添加轮廓/描边效果?
我发现大多数流行的图像特效库(例如glfx.js和Pixastic)都没有描边效果。我在StackOverflow上找到的最接近的解决方案是使用模糊效果来产生发光效果,而不是描边效果。
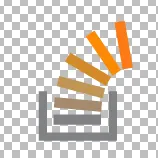
原始图片
可以具有多个分离形状的透明PNG图像:
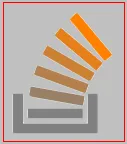
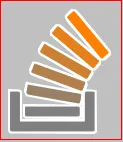
生成的图片
应用于其的轮廓描边和阴影的透明图像。

继续搜索...
我将更新此列表,以寻找实现描边效果的最简单方法。相关问题:
如何使用JavaScript canvas最简单地为透明PNG图像添加轮廓/描边效果?
我发现大多数流行的图像特效库(例如glfx.js和Pixastic)都没有描边效果。我在StackOverflow上找到的最接近的解决方案是使用模糊效果来产生发光效果,而不是描边效果。
原始图片
可以具有多个分离形状的透明PNG图像:
生成的图片
应用于其的轮廓描边和阴影的透明图像。
继续搜索...
我将更新此列表,以寻找实现描边效果的最简单方法。相关问题:
这里是一种在你的图片上添加“贴纸效果”的方法...
示例: http://jsfiddle.net/m1erickson/Q2j3L/

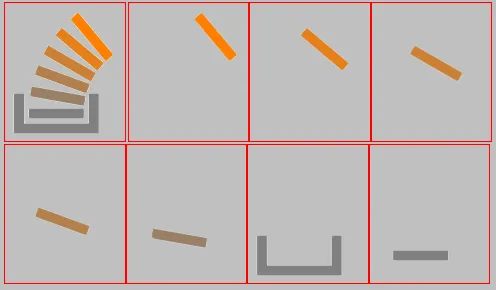
首先,在主画布上绘制原始图像。
将图像分解为“离散元素”。
离散元素由相互连接而不与其他元素连接的像素组成。例如,精灵表中的每个单独的精灵都是一个离散元素。
您可以使用"Marching Squares"等边缘检测算法找到离散像素组。
将每个离散元素放在自己的画布上进行进一步处理。还要从主画布中擦除该离散元素(以便它不会再次处理)。
检测每个离散元素的轮廓路径。
您可以再次使用“Marching Squares”算法进行边缘检测。 marching squares的结果是一个由x / y坐标组成的数组,形成元素的外部轮廓
创建“贴纸效果”
你可以通过在每个元素周围绘制白色描边来创建贴纸效果。 通过描绘上述计算出的轮廓路径来实现此目的。您可以选择为描边添加阴影。
注意:画布描边总是在路径的内部和外部各画一半。这意味着贴纸描边会侵入元素内部。为了修复此问题:在绘制了贴纸描边后,您应该将元素重新绘制到上面。这将覆盖掉贴纸描边的侵入部分。
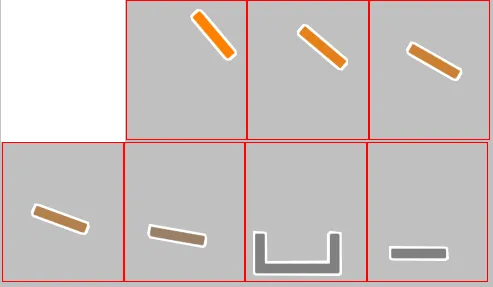
重新合成包括贴纸效果的最终图像
通过将每个元素的画布层叠到主画布上来重新合成最终图像
以下是有注释的示例代码:
<!doctype html>
<html>
<head>
<link rel="stylesheet" type="text/css" media="all" href="css/reset.css" /> <!-- reset css -->
<script src="http://code.jquery.com/jquery.min.js"></script>
<script src="marching squares.js"></script>
<style>
    body{ background-color:silver; }
    canvas{border:1px solid red;}
</style>
<script>
$(function(){

    // canvas related variables
    var canvas=document.getElementById("canvas");
    var ctx=canvas.getContext("2d");

    // variables used in pixel manipulation
    var canvases=[];
    var imageData,data,imageData1,data1;

    // size of sticker outline
    var strokeWeight=8;

    // true/false function used by the edge detection method
    var defineNonTransparent=function(x,y){
        return(data1[(y*cw+x)*4+3]>0);
    }

    // the image receiving the sticker effect
    var img=new Image();
    img.crossOrigin="anonymous";
    img.onload=start;
    img.src="https://dl.dropboxusercontent.com/u/139992952/multple/makeIndividual.png";
    //img.src="https://dl.dropboxusercontent.com/u/139992952/stackoverflow/angryBirds.png";

    function start(){

        // resize the main canvas to the image size
        canvas.width=cw=img.width;
        canvas.height=ch=img.height;

        // draw the image on the main canvas
        ctx.drawImage(img,0,0);

        // Move every discrete element from the main canvas to a separate canvas
        // The sticker effect is applied individually to each discrete element and
        // is done on a separate canvas for each discrete element
        while(moveDiscreteElementToNewCanvas()){}

        // add the sticker effect to all discrete elements (each canvas)
        for(var i=0;i<canvases.length;i++){
            addStickerEffect(canvases[i],strokeWeight);
            ctx.drawImage(canvases[i],0,0);
        }

        // redraw the original image
        //   (necessary because the sticker effect
        //    slightly intrudes on the discrete elements)
        ctx.drawImage(img,0,0);

    }

    //
    function addStickerEffect(canvas,strokeWeight){
        var url=canvas.toDataURL();
        var ctx1=canvas.getContext("2d");
        var pts=canvas.outlinePoints;
        addStickerLayer(ctx1,pts,strokeWeight);
        var imgx=new Image();
        imgx.onload=function(){
            ctx1.drawImage(imgx,0,0);
        }
        imgx.src=url;
    }


    function addStickerLayer(context,points,weight){

        imageData=context.getImageData(0,0,canvas.width,canvas.height);
        data1=imageData.data;

        var points=geom.contour(defineNonTransparent);

        defineGeomPath(context,points)
        context.lineJoin="round";
        context.lineCap="round";
        context.strokeStyle="white";
        context.lineWidth=weight;
        context.stroke();
    }

    // This function finds discrete elements on the image
    // (discrete elements == a group of pixels not touching
    //  another groups of pixels--e.g. each individual sprite on
    //  a spritesheet is a discreet element)
    function moveDiscreteElementToNewCanvas(){

        // get the imageData of the main canvas
        imageData=ctx.getImageData(0,0,canvas.width,canvas.height);
        data1=imageData.data;

        // test & return if the main canvas is empty
        // Note: do this b/ geom.contour will fatal-error if canvas is empty
        var hit=false;
        for(var i=0;i<data1.length;i+=4){
            if(data1[i+3]>0){hit=true;break;}
        }
        if(!hit){return;}

        // get the point-path that outlines a discrete element
        var points=geom.contour(defineNonTransparent);

        // create a new canvas and append it to page
        var newCanvas=document.createElement('canvas');
        newCanvas.width=canvas.width;
        newCanvas.height=canvas.height;
        document.body.appendChild(newCanvas);
        canvases.push(newCanvas);
        var newCtx=newCanvas.getContext('2d');

        // attach the outline points to the new canvas (needed later)
        newCanvas.outlinePoints=points;

        // draw just that element to the new canvas
        defineGeomPath(newCtx,points);
        newCtx.save();
        newCtx.clip();
        newCtx.drawImage(canvas,0,0);
        newCtx.restore();

        // remove the element from the main canvas
        defineGeomPath(ctx,points);
        ctx.save();
        ctx.clip();
        ctx.globalCompositeOperation="destination-out";
        ctx.clearRect(0,0,canvas.width,canvas.height);
        ctx.restore();

        return(true);
    }


    // utility function
    // Defines a path on the canvas without stroking or filling that path
    function defineGeomPath(context,points){
        context.beginPath();
        context.moveTo(points[0][0],points[0][1]);
        for(var i=1;i<points.length;i++){
            context.lineTo(points[i][0],points[i][1]);
        }
        context.lineTo(points[0][0],points[0][1]);
        context.closePath();
    }

}); // end $(function(){});
</script>
</head>
<body>
    <canvas id="canvas" width=300 height=300></canvas><br>
</body>
</html>
这是一个 marching squares 边缘检测算法(来自优秀的开源 d3 库):
/**
 * Computes a contour for a given input grid function using the <a
 * href="http://en.wikipedia.org/wiki/Marching_squares">marching
 * squares</a> algorithm. Returns the contour polygon as an array of points.
 *
 * @param grid a two-input function(x, y) that returns true for values
 * inside the contour and false for values outside the contour.
 * @param start an optional starting point [x, y] on the grid.
 * @returns polygon [[x1, y1], [x2, y2], ...]

 */
 (function(){

geom = {};
geom.contour = function(grid, start) {
  var s = start || d3_geom_contourStart(grid), // starting point
      c = [],    // contour polygon
      x = s[0],  // current x position
      y = s[1],  // current y position
      dx = 0,    // next x direction
      dy = 0,    // next y direction
      pdx = NaN, // previous x direction
      pdy = NaN, // previous y direction
      i = 0;

  do {
    // determine marching squares index
    i = 0;
    if (grid(x-1, y-1)) i += 1;
    if (grid(x,   y-1)) i += 2;
    if (grid(x-1, y  )) i += 4;
    if (grid(x,   y  )) i += 8;

    // determine next direction
    if (i === 6) {
      dx = pdy === -1 ? -1 : 1;
      dy = 0;
    } else if (i === 9) {
      dx = 0;
      dy = pdx === 1 ? -1 : 1;
    } else {
      dx = d3_geom_contourDx[i];
      dy = d3_geom_contourDy[i];
    }

    // update contour polygon
    if (dx != pdx && dy != pdy) {
      c.push([x, y]);
      pdx = dx;
      pdy = dy;
    }

    x += dx;
    y += dy;
  } while (s[0] != x || s[1] != y);

  return c;
};

// lookup tables for marching directions
var d3_geom_contourDx = [1, 0, 1, 1,-1, 0,-1, 1,0, 0,0,0,-1, 0,-1,NaN],
    d3_geom_contourDy = [0,-1, 0, 0, 0,-1, 0, 0,1,-1,1,1, 0,-1, 0,NaN];

function d3_geom_contourStart(grid) {
  var x = 0,
      y = 0;

  // search for a starting point; begin at origin
  // and proceed along outward-expanding diagonals
  while (true) {
    if (grid(x,y)) {
      return [x,y];
    }
    if (x === 0) {
      x = y + 1;
      y = 0;
    } else {
      x = x - 1;
      y = y + 1;
    }
  }
}

})();
注意:此代码将应用贴纸轮廓的过程分离到单独的函数中。这样做是为了以防您想要在离散元素周围有多个图层。例如,您可能希望在贴纸描边的外侧添加第二个灰色边框。如果您不需要应用“图层”,则可以在moveDiscreteElementToNewCanvas函数内应用贴纸描边。