使用Lazy<T>时抛出StackOverflowException异常

9
一个非常简单的示例应用程序(.NET 4.6.2)在递归深度为12737时会产生StackOverflowException,如果最内部的函数调用抛出异常,则递归深度将降至10243,这是预期的并且可以接受的。
如果我使用Lazy<T>来短暂地保存中间结果,如果没有异常抛出,StackOverflowException已经在递归深度为2207时发生,如果有异常抛出,则在递归深度为105时发生。
注意:只有编译为x64时,才能观察到递归深度为105的StackOverflowException。对于x86(32位),该效果首先发生在深度为4272的位置。Mono(如https://repl.it所使用的)在深度为74200之前都可以正常工作。
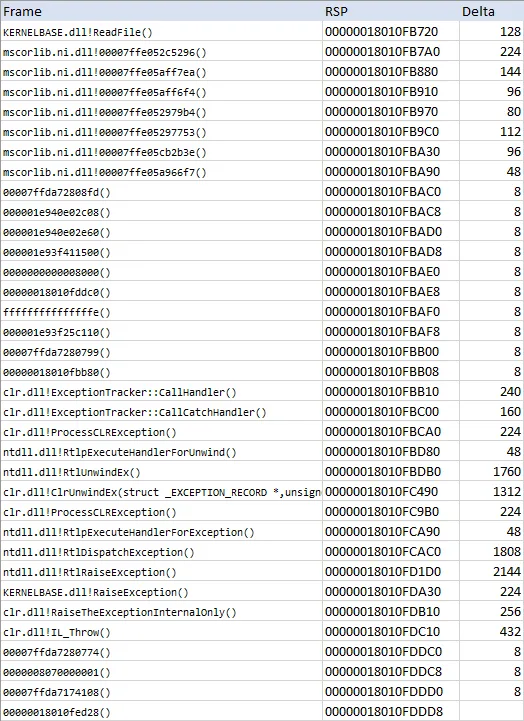
StackOverflowException不会在深度递归中发生,而是在返回主例程时发生。 finally块在一些深度上被处理,然后程序死亡:
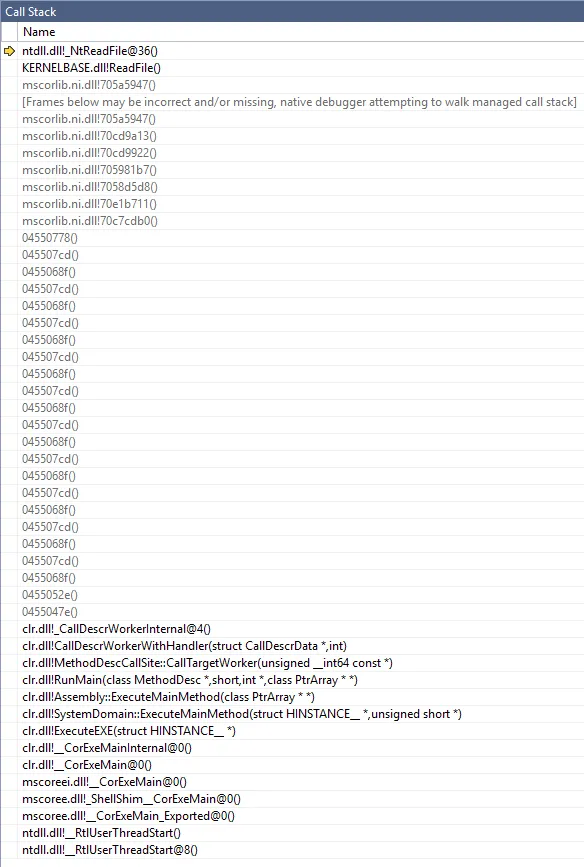
Exception System.InvalidOperationException at 105
Finally at 105
...
Exception System.InvalidOperationException at 55
Finally at 55
Exception System.InvalidOperationException at 54
Finally at 54
Process is terminated due to StackOverflowException.

或者在调试器中:
The program '[xxxxx] Test.vshost.exe' has exited with code -2147023895 (0x800703e9).

谁能解释这个?
public class Program
{
    private class Test
    {
        private int maxDepth;

        private int CalculateWithLazy(int depth)
        {
            try
            {
                var lazy = new Lazy<int>(() => this.Calculate(depth));
                return lazy.Value;
            }  
            catch (Exception e)
            {
                Console.WriteLine("Exception " + e.GetType() + " at " + depth);
                throw;
            }
            finally
            {
                Console.WriteLine("Finally at " + depth);
            }
        }

        private int Calculate(int depth)
        {
            if (depth >= this.maxDepth) throw new InvalidOperationException("Max. recursion depth reached.");
            return this.CalculateWithLazy(depth + 1);
        }

        public void Run()
        {
            for (int i = 1; i < 100000; i++)
            {
                this.maxDepth = i;

                try
                {
                    Console.WriteLine("MaxDepth: " + i);
                    this.CalculateWithLazy(0);

                }
                catch { /* ignore */ }
            }
        }
    }

    public static void Main(string[] args)
    {
        var test = new Test();
        test.Run();
        Console.Read();
    }

更新:问题可以在递归方法中使用try-catch-throw块而不使用Lazy<T>来重现。
        [MethodImpl(MethodImplOptions.NoInlining)]
        private int Calculate(int depth)
        {
            try
            {
                if (depth >= this.maxDepth) throw new InvalidOperationException("Max. recursion depth reached.");
                return this.Calculate2(depth + 1);
            }
            catch
            {
                throw;
            }
        }

        [MethodImpl(MethodImplOptions.NoInlining)]
        private int Calculate2(int depth) // just to prevent the compiler from tail-recursion-optimization
        {
            return this.Calculate(depth);
        }

        public void Run()
        {
            for (int i = 1; i < 100000; i++)
            {
                this.maxDepth = i;

                try
                {
                    Console.WriteLine("MaxDepth: " + i);
                    this.Calculate(0);

                }
                catch(Exception e)
                {
                    Console.WriteLine("Finished with " + e.GetType());
                }
            }
        }

1
CalculateWithLazy 调用 Calculate,而 Calculate 又调用 CalculateWithLazy。你有没有注意到这一点?这就是递归发生的无限循环,并导致堆栈溢出异常。 - Chetan
你的问题是“为什么函数使用堆栈而不是堆来存储局部变量”还是“如何估计函数的堆栈使用情况而不运行它”,或者其他什么问题? - Alexei Levenkov
2
@chetan的问题不是为什么会发生堆栈溢出,而是为什么它会在不同的深度发生。 - Alexei Levenkov
“StackOverflowException已经发生(...),如果抛出异常,则递归深度为105。”我不确定这是什么意思。如果您在代码中引发InvalidOperationException,那么是否会进一步触发StackOverflowException? - Asik
其中一个原因是你的 catch { throw; } 在每一帧都重新抛出了这个异常(由于递归,你的 try 块被嵌套:try { try { try { ...)。因此,异常被捕获并重新抛出了 <最大递归深度> 次,这显然会消耗相当多的堆栈空间。 - Evk
3个回答

10
问题可以在递归方法中使用try-catch-throw块而不使用 Lazy<T>来重现。 您已经注意到了行为的来源。 现在让我解释一下为什么,因为这没有意义,对吧? 这没有意义,因为异常被捕获然后立即重新抛出,所以堆栈应该缩小,对吧? 下面是测试:
internal class Program
{
    private int _maxDepth;

    [MethodImpl(MethodImplOptions.NoInlining)]
    private int Calculate(int depth)
    {
        try
        {
            Console.WriteLine("In try at depth {0}: stack frame count = {1}", depth, new StackTrace().FrameCount);

            if (depth >= _maxDepth)
                throw new InvalidOperationException("Max. recursion depth reached.");

            return Calculate2(depth + 1);
        }
        catch
        {
            Console.WriteLine("In catch at depth {0}: stack frame count = {1}", depth, new StackTrace().FrameCount);
            throw;
        }
    }

    [MethodImpl(MethodImplOptions.NoInlining)]
    private int Calculate2(int depth) => Calculate(depth);

    public void Run()
    {
        try
        {
            _maxDepth = 10;
            Calculate(0);
        }
        catch (Exception e)
        {
            Console.WriteLine("Finished with " + e.GetType());
        }
    }

    public static void Main() => new Program().Run();
}

看起来验证了那个假设:

In try at depth 0: stack frame count = 3
In try at depth 1: stack frame count = 5
In try at depth 2: stack frame count = 7
In try at depth 3: stack frame count = 9
In try at depth 4: stack frame count = 11
In try at depth 5: stack frame count = 13
In try at depth 6: stack frame count = 15
In try at depth 7: stack frame count = 17
In try at depth 8: stack frame count = 19
In try at depth 9: stack frame count = 21
In try at depth 10: stack frame count = 23
In catch at depth 10: stack frame count = 23
In catch at depth 9: stack frame count = 21
In catch at depth 8: stack frame count = 19
In catch at depth 7: stack frame count = 17
In catch at depth 6: stack frame count = 15
In catch at depth 5: stack frame count = 13
In catch at depth 4: stack frame count = 11
In catch at depth 3: stack frame count = 9
In catch at depth 2: stack frame count = 7
In catch at depth 1: stack frame count = 5
In catch at depth 0: stack frame count = 3
Finished with System.InvalidOperationException

好的...不,事情并不那么简单。


.NET异常是建立在Windows结构化异常处理(SEH)之上的,这是一个复杂的东西。

如果您想了解详细信息,有两篇文章需要阅读。它们已经过时,但与您的问题相关的部分仍然准确:

但让我们集中精力解决手头的问题,即堆栈展开。

以下是第一篇文章中关于堆栈展开发生的情况(重点在我这里):

另一种取消操作是实际弹出CPU堆栈。这种情况并不像弹出SEH记录那样急切。在X86上,EBP用作包含SEH的方法的帧指针。ESP始终指向堆栈顶部。在堆栈实际取消之前,所有处理程序都在故障异常帧的顶部执行。因此,当第一次或第二次调用处理程序时,堆栈实际上会增长。将EBP设置为包含过滤器或最后一个子句的方法的帧,以便该方法的局部变量处于范围内。 直到执行捕获“except”子句时,才会实际弹出堆栈。让我们修改我们先前的测试程序来检查这一点:
internal class Program
{
    private int _maxDepth;
    private UIntPtr _stackStart;

    [MethodImpl(MethodImplOptions.NoInlining)]
    private int Calculate(int depth)
    {
        try
        {
            Console.WriteLine("In try at depth {0}: stack frame count = {1}, stack offset = {2}",depth, new StackTrace().FrameCount, GetLooseStackOffset());

            if (depth >= _maxDepth)
                throw new InvalidOperationException("Max. recursion depth reached.");

            return Calculate2(depth + 1);
        }
        catch
        {
            Console.WriteLine("In catch at depth {0}: stack frame count = {1}, stack offset = {2}", depth, new StackTrace().FrameCount, GetLooseStackOffset());
            throw;
        }
    }

    [MethodImpl(MethodImplOptions.NoInlining)]
    private int Calculate2(int depth) => Calculate(depth);

    public void Run()
    {
        try
        {
            _stackStart = GetSomePointerNearTheTopOfTheStack();
            _maxDepth = 10;
            Calculate(0);
        }
        catch (Exception e)
        {
            Console.WriteLine("Finished with " + e.GetType());
        }
    }

    [MethodImpl(MethodImplOptions.NoInlining)]
    private static unsafe UIntPtr GetSomePointerNearTheTopOfTheStack()
    {
        int dummy;
        return new UIntPtr(&dummy);
    }

    private int GetLooseStackOffset() => (int)((ulong)_stackStart - (ulong)GetSomePointerNearTheTopOfTheStack());

    public static void Main() => new Program().Run();
}

这是结果:

In try at depth 0: stack frame count = 3, stack offset = 384
In try at depth 1: stack frame count = 5, stack offset = 752
In try at depth 2: stack frame count = 7, stack offset = 1120
In try at depth 3: stack frame count = 9, stack offset = 1488
In try at depth 4: stack frame count = 11, stack offset = 1856
In try at depth 5: stack frame count = 13, stack offset = 2224
In try at depth 6: stack frame count = 15, stack offset = 2592
In try at depth 7: stack frame count = 17, stack offset = 2960
In try at depth 8: stack frame count = 19, stack offset = 3328
In try at depth 9: stack frame count = 21, stack offset = 3696
In try at depth 10: stack frame count = 23, stack offset = 4064
In catch at depth 10: stack frame count = 23, stack offset = 13024
In catch at depth 9: stack frame count = 21, stack offset = 21888
In catch at depth 8: stack frame count = 19, stack offset = 30752
In catch at depth 7: stack frame count = 17, stack offset = 39616
In catch at depth 6: stack frame count = 15, stack offset = 48480
In catch at depth 5: stack frame count = 13, stack offset = 57344
In catch at depth 4: stack frame count = 11, stack offset = 66208
In catch at depth 3: stack frame count = 9, stack offset = 75072
In catch at depth 2: stack frame count = 7, stack offset = 83936
In catch at depth 1: stack frame count = 5, stack offset = 92800
In catch at depth 0: stack frame count = 3, stack offset = 101664
Finished with System.InvalidOperationException

抱歉。是的,在处理异常时堆栈实际上会增长。
_maxDepth = 1000 时,执行将在此结束:
In catch at depth 933: stack frame count = 1869, stack offset = 971232
In catch at depth 932: stack frame count = 1867, stack offset = 980096
In catch at depth 931: stack frame count = 1865, stack offset = 988960
In catch at depth 930: stack frame count = 1863, stack offset = 997824

Process is terminated due to StackOverflowException.

所以我们自己的代码使用了大约997824字节的堆栈空间,这非常接近Windows上默认的1 MB线程堆栈大小。调用CLR代码应该弥补差距。


正如您所知,SEH异常在两个阶段中处理:

  • 第一阶段(过滤)找到能够处理该异常的第一个异常处理程序。在C#中,这基本上检查catch子句是否匹配正确的异常类型,并执行catch (...) when (...)when部分(如果存在)。
  • 第二阶段(展开)实际上处理异常。

以下是第二篇文章对展开过程的描述:

当发生异常时,系统遍历EXCEPTION_REGISTRATION结构列表,直到找到异常处理程序。找到处理程序后,系统再次遍历列表,直到处理异常的节点。在第二次遍历期间,系统第二次调用每个处理程序函数。关键区别在于,在第二次调用中,异常标志设置为2。此值对应于EH_UNWINDING

[...]

在处理异常并调用所有先前的异常帧进行展开之后,执行继续到处理回调决定的位置。

这只是确认了第一篇文章所说的内容。

第一阶段需要保留故障堆栈以便能够检查其状态,并能够在故障指令上恢复执行(是的,这是一件事情-它非常低级,但您可以修补错误的原因并继续执行,就好像第一次没有错误一样)。

第二次遍历的实现方式与第一次相同,只是处理程序现在获得了EH_UNWINDING标志。这意味着在那一点上,故障堆栈仍然被保留,直到最终的处理程序决定在哪里恢复执行。

在堆栈展开时,32位进程的堆栈指针移动了36个字节,而64位进程的堆栈指针移动了惊人的8976个字节。这是为什么呢?

好问题!

这是因为32位和64位的SEH完全不同。这里有一些阅读材料(重点是我的):

由于在x86上,使用SEH的每个函数都将该结构作为其前奏部分的一部分,因此x86被称为基于帧的异常处理。这种方法存在几个问题:
- 由于异常信息存储在堆栈上,所以容易受到缓冲区溢出攻击的影响。 - 开销。异常是罕见的,这意味着异常不会发生在常见情况下。但无论如何,在每次输入使用SEH的函数时,都会执行这些额外的指令。
由于x64是摆脱了几十年的混乱,SEH得到了改进,解决了上述两个问题。在x64上,SEH已经变成了基于表的形式,这意味着在编译源代码时,将创建一个表,完全描述模块中所有异常处理代码。然后将此表存储为PE头的一部分。如果发生异常,则Windows会通过解析异常表来查找适当的异常处理程序进行执行。由于异常处理信息安全地藏在PE头中,因此不再容易受到缓冲区溢出攻击的影响。此外,由于异常表是作为编译过程的一部分生成的,因此正常处理过程中不会产生运行时开销(以push和pop指令的形式)。
当然,基于表的异常处理方案也有一些负面方面。例如,基于表的方案在内存中占用的空间更多。此外,虽然正常执行路径中的开销降低了,但处理异常需要的开销比基于帧的方法要高得多。像生活中的所有事情一样,在评估基于表还是基于帧的异常处理方法“最好”时,需要考虑权衡。
简而言之,x64优化了正常的路径,而异常路径变得更慢。如果你问我,这是一件非常好的事情。
以下是我之前链接的第一篇文章中的另一段引用:
“IA64和AMD64都有一个异常处理模型,避免了依赖于TLS中开始并沿着堆栈线程传递的显式处理程序链。相反,异常处理依赖于64位系统上我们可以完全展开堆栈的事实。这种能力本身是由于这些芯片所支持的调用约定非常受限制。”
“无论如何,在64位系统上,堆栈上的激活记录与适用于它的异常记录之间的对应关系不是通过FS:[0]链实现的。相反,堆栈的展开显示了对应于特定激活记录的代码地址。方法的这些指令指针在表中查找,以查找是否有任何__try / __except / __finally子句覆盖这些代码地址。该表还通过描述方法收场动作来指示如何进行展开。”
所以,是的。 完全不同的方法。
但让我们看一下x64调用堆栈,以查看堆栈空间实际上是如何使用的。 我将Calculate修改为以下内容:
private int Calculate(int depth)
{
    try
    {
        if (depth >= _maxDepth)
            throw new InvalidOperationException("Max. recursion depth reached.");

        return Calculate2(depth + 1);
    }
    catch
    {
        if (depth == _maxDepth)
        {
            Console.ReadLine();
        }

        throw;
    }
}

我在Console.ReadLine();上设置了断点,并查看了每个帧的本地调用堆栈以及堆栈指针寄存器的值:

native call stack

这些地址fffffffffffffffe0000000000008000看起来很奇怪,但无论如何,这显示了每个框架消耗的堆栈空间。在Windows本机API(ntdll.dll)中有很多东西正在进行,而CLR添加了一些。

就内部Windows内容而言,我们没有运气,因为源代码不公开。但是,我们至少可以查看clr.dll!ClrUnwindEx,因为该函数相当小但使用了相当多的堆栈空间:

void ClrUnwindEx(EXCEPTION_RECORD* pExceptionRecord, UINT_PTR ReturnValue, UINT_PTR TargetIP, UINT_PTR TargetFrameSp)
{
    PVOID TargetFrame = (PVOID)TargetFrameSp;

    CONTEXT ctx;
    RtlUnwindEx(TargetFrame,
                (PVOID)TargetIP,
                pExceptionRecord,
                (PVOID)ReturnValue, // ReturnValue
                &ctx,
                NULL);      // HistoryTable

    // doesn't return
    UNREACHABLE();
}

它在栈上定义了一个名为CONTEXT的变量,它是一个大结构体。我只能推测64位SEH函数使用它们的栈空间进行类似的操作。

现在让我们将其与32位调用栈进行比较:

32-bit call stack

作为您可以看到的,这与64位完全不同

出于好奇心,我测试了一个简单的C++程序的行为:

#include "stdafx.h"
#include <iostream>

__declspec(noinline) static char* GetSomePointerNearTheTopOfTheStack()
{
    char dummy;
    return &dummy;
}

int main()
{
    auto start = GetSomePointerNearTheTopOfTheStack();

    try
    {
        throw 42;
    }
    catch (...)
    {
        auto here = GetSomePointerNearTheTopOfTheStack();
        std::cout << "Difference in " << (sizeof(char*) * 8) << "-bit: " << (start - here) << std::endl;
    }

    return 0;
}

这里是结果:
Difference in 32-bit: 2224
Difference in 64-bit: 9744

这进一步表明这不仅仅是CLR的事情,而是由底层SEH实现差异导致的。


在展开堆栈时,32位进程的堆栈指针移动了36个字节,而64位进程则移动了惊人的8976个字节。这是什么原因呢? - Rauhotz

1
有两个原因:
  1. Lazy在堆栈上使用更多的内存(只是多了一个变量)
  2. Lazy添加更多的堆栈帧(因为它调用一个委托)
请阅读以下内容以获取更多详细信息:
分配给您的调用堆栈的内存量是固定的(这是ThreadmaxStackSize
因此,适合于该固定内存量的堆栈帧的数量取决于这些堆栈帧的大小
如果您在方法内部使用其他变量,则必须将它们写入堆栈,并占用内存。
另外,如果使用Lazy<T>,则堆栈帧的数量将会有所变化,因为它持有需要进行一次额外调用的委托(即一个您不计算的额外堆栈帧)。
这正是您所遇到的问题,如果您在CalculateWithLazy内使用额外的lazy变量,那么您的堆栈帧只会占用更多空间,这就是为什么在程序由于StackOverflowException而失败之前,堆栈帧数量较少的原因。
可以更精确地计算,但我认为这个近似解释足以理解不同行为的原因。
以下是如何查找线程的maxStackSize如何在.net中找到当前线程的最大堆栈大小? 以下是如何查找引用类型变量的大小(取决于平台+一些开销): C#引用需要多少内存? 最后,你的代码中只有 System.Int32,因此它占用 32 字节的内存。
如果你有任何自定义结构体(值类型),计算它们的大小将是一个挑战,请参考 @Hans Passant 在这个问题中的答案: 如何检查结构体所消耗的字节数?

请查看我的更新问题。问题似乎与异常处理有关。 - Rauhotz
@Rauhotz,现在我终于明白你的问题是什么了。 “为什么在弹出调用堆栈帧时会发生StackOverflow而不是在推入它们时发生” 我的猜测可能是异常信息中序列化的堆栈跟踪占用的空间比原始堆栈帧本身更多,但我不确定。我需要自己进行一些研究 :-) - ironstone13
嗯,我不得不进行很多实验才能确定这是一个try-catch-throw问题,而且只限于x64,也许我需要重新表述整个问题。 - Rauhotz

0

使用Lazy会增加更多的调用:调用Value属性,可能是委托上的Invoke以及可能取决于它如何实现的其他调用。您的调试器调用堆栈可以帮助可视化正在发生的情况。


网页内容由stack overflow 提供, 点击上面的
可以查看英文原文,
原文链接