我正在尝试在R中计算栅格图像的移动多数值。栅格包中的focal函数只提供平均值、最小值和最大值。我有一个带有3个值(1、2和3)的栅格图像,我想要在中心设置一个3x3的窗口,并获得最常见的值。在R中,最有效的方法是什么?谢谢!
library(raster)
# create data
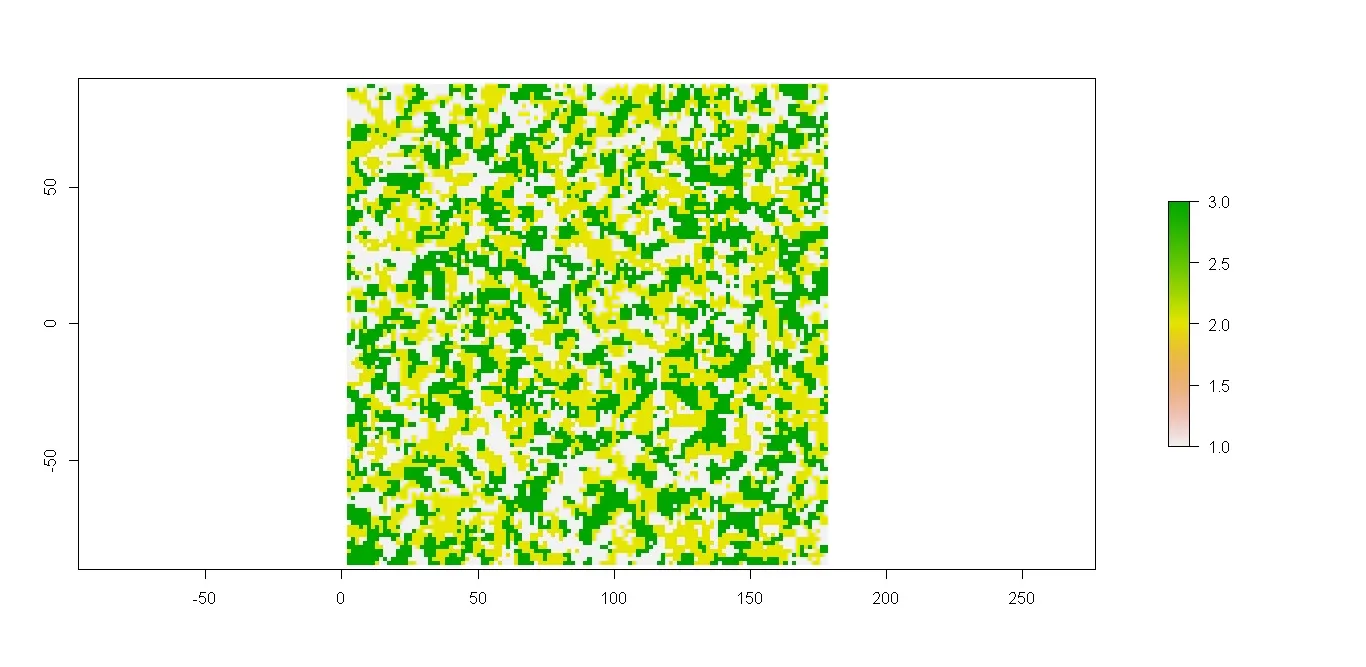
r <- raster(nrows = 120, ncol = 120, xmn=0)
r[] <- sample(3, ncell(r), replace=TRUE)
 。
。
terra中仍然有效,但是通过@maycca调用focal的modal不适用于raster之外。 - Jeffrey Evans