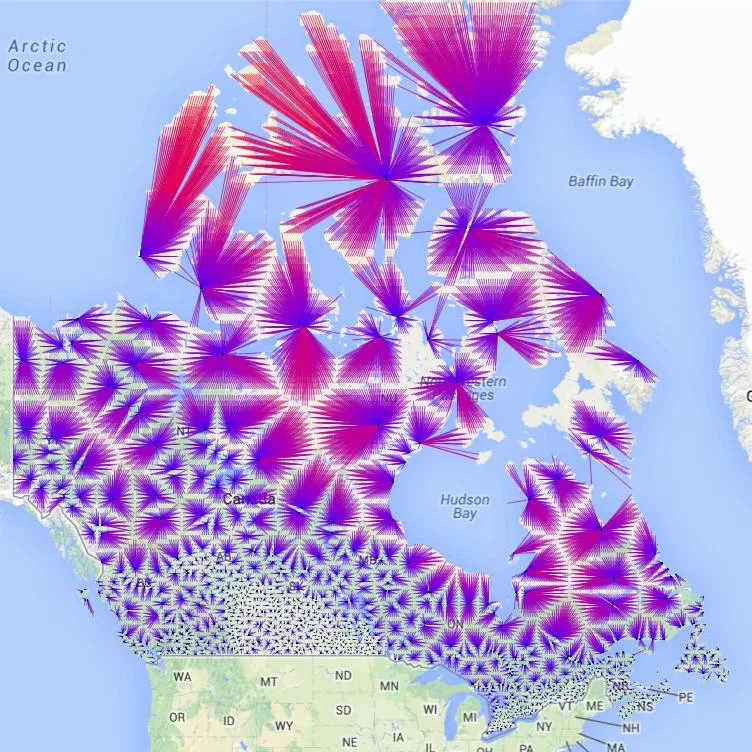
在以下脚本中,我读取了许多点对,并在地图上绘制了线条。我使用ggmap从谷歌拉取地图,将这些线条绘制在地图上:
很遗憾,由于加拿大位于北纬较高的位置,这会导致地图顶部的距离发生严重畸变:
source('./library/latlong2state.R')

library(maps)
library(mapproj)
library(mapdata)
library(geosphere)
library(ggmap)

fileName = "_CanadaData/CanadaHospitalComplete.csv"

getLineColor <- function(val) {
  pal <- colorRampPalette(lineColours)
  colors <- pal(80)
  val.log <- log(val)

  if (val > 50) {
    col <- colors[80]
  } else {
    colindex <- max(1, round( 80 * val / 50))
    col <- colors[colindex]
  }
  return(col)
}

# Load the data
location <- read.csv(fileName, stringsAsFactors=FALSE)

# Omit locations that are not on the map of focus (not needed for city maps unless they are on a border)
location$state <- latlong2state(data.frame(location$lng, location$lat))
location$nearstate <- latlong2state(data.frame(location$lngnear, location$latnear))
location <- na.omit(location)

createMap <- function(bbox, thedata, mapzoom=3, linesize=0.6, pointsize=2) {
  basemap <- get_map(location=bbox, zoom=mapzoom, source='google', maptype="roadmap", color="color")
  ggmap(basemap) + geom_segment(aes(x=lng, xend=lngnear, y=lat, yend=latnear, color=dist_miles), size=0.6, data=thedata) + geom_point(aes(x=lngnear, y=latnear), size=2, color="#000000", border="black", data=thedata) + scale_color_gradient(low="blue", high="red", limits=c(0, max(thedata$dist_miles))) + coord_map("orthographic")
}

# Country bounding box c(left, bottom, right, top)
canada <- c(-140.920514, 42.016722, -52.524864, 83.2911)
createMap(canada, location)
很遗憾,由于加拿大位于北纬较高的位置,这会导致地图顶部的距离发生严重畸变:
projection=mapprojection(orthographic)即可更改线条绘制的投影方式。但是,我无法更改从谷歌获取的地图图像的投影方式 - 它被固定在Web Mercator投影中。使用ggmap能否解决此问题?或者我需要尝试其他软件包吗?如果是,请问您有什么推荐?