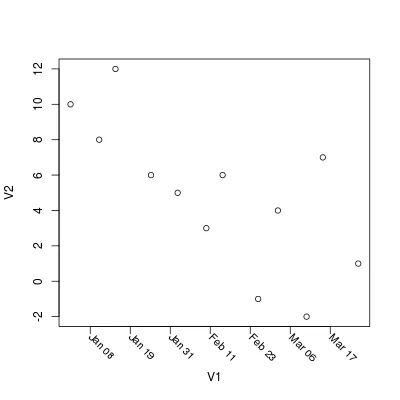
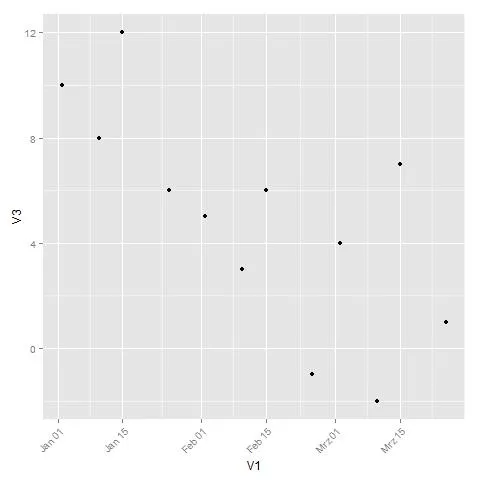
在R中将旋转标签绘制在x轴上。

5
我需要绘制这些数据:
day                 temperature
02/01/2012 13:30:00     10 
10/01/2012 20:30:00      8  
15/01/2012 13:30:00     12
25/01/2012 20:30:00      6
02/02/2012 13:30:00      5
10/02/2012 20:30:00      3
15/02/2012 13:30:00      6
25/02/2012 20:30:00     -1
02/03/2012 13:30:00      4
10/03/2012 20:30:00     -2
15/03/2012 13:30:00      7
25/03/2012 20:30:00      1

在x轴上,我想标记只有月份和日期(例如Jan 02),旋转45度。如何使用plot()命令实现?


请查看?par,特别是las参数。但它仅支持0、90、180、270度。 - sgibb
2个回答

7

使用基础图形:

tab <- read.table(textConnection('
"02/01/2012 13:30:00"     10
"10/01/2012 20:30:00"      8
"15/01/2012 13:30:00"     12
"25/01/2012 20:30:00"      6
"02/02/2012 13:30:00"      5
"10/02/2012 20:30:00"      3
"15/02/2012 13:30:00"      6
"25/02/2012 20:30:00"     -1
"02/03/2012 13:30:00"      4
"10/03/2012 20:30:00"     -2
"15/03/2012 13:30:00"      7
"25/03/2012 20:30:00"      1'))
tab[, 1] <- as.POSIXct(tab[, 1], format = "%d/%m/%Y %H:%M:%S")

plot(V2 ~ V1, data=tab, xaxt="n")
tck <- axis(1, labels=FALSE)
labels <- format(as.POSIXct(tck, origin="1970-01-01"), "%b %d")
text(tck, par("usr")[3], labels=labels, srt=315,
     xpd=TRUE, adj=c(-0.2,1.2), cex=0.9)

R plot


3
使用ggplot进行数据可视化:
tab <- read.table(textConnection("
02/01/2012 13:30:00     10 
10/01/2012 20:30:00      8  
15/01/2012 13:30:00     12
25/01/2012 20:30:00      6
02/02/2012 13:30:00      5
10/02/2012 20:30:00      3
15/02/2012 13:30:00      6
25/02/2012 20:30:00     -1
02/03/2012 13:30:00      4
10/03/2012 20:30:00     -2
15/03/2012 13:30:00      7
25/03/2012 20:30:00      1"))


tab[, 1] <- as.Date(tab[, 1], format = "%d/%m/%Y")

library(ggplot2)
ggplot(tab) + geom_point(aes(x = V1, y = V3)) + 
        theme(axis.text.x = element_text(angle = 45, hjust = 1))

enter image description here


网页内容由stack overflow 提供, 点击上面的
可以查看英文原文,
原文链接