我正在尝试使用Goeviews中的Path对象在Jupyter Notebook中可视化一些LINESTRINGS。该路径应根据交通量进行颜色编码(请参见下面的示例)。
我阅读了相关帖子Displaying Paths with Geoviews,给定的示例对我很有用。
但是,对于Linestrings,着色似乎不起作用。我错过了什么吗?非常感谢您的任何帮助!
但是,对于Linestrings,着色似乎不起作用。我错过了什么吗?非常感谢您的任何帮助!
import requests
import geopandas as gpd
import json

import holoviews as hv
import geoviews as gv
hv.extension('bokeh')

url = 'http://stadtplan.bonn.de/geojson?Thema=19584'
r = requests.get(url)
data = r.json()
gdf_traffic = gpd.GeoDataFrame.from_features(data['features'])
gdf_traffic.head(1)


#'geschwindigkeit' = 'traffic' in German
%%opts Path [width=500 height=500 color_index="geschwindigkeit"] (cmap='inferno')

gv.Path(gdf_traffic, vdims=["geschwindigkeit"])
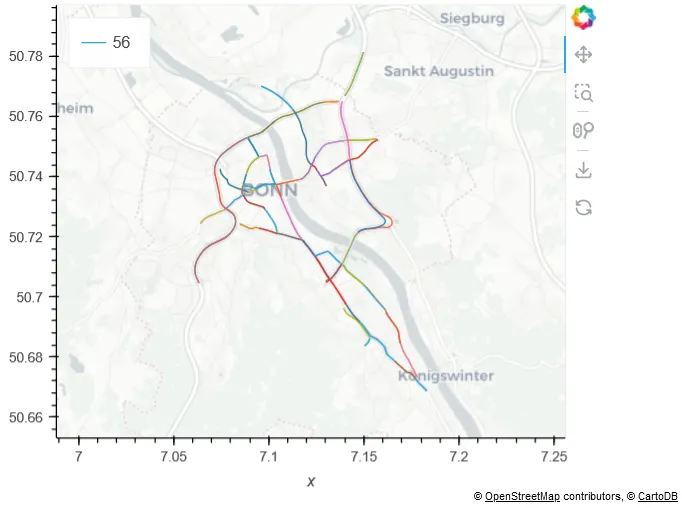
geschwindigkeit来确定。 - undefined