我需要在运行时生成动态图表,将其保存为PNG图像格式(透明背景),并嵌入PDF中。问题是,在页面上没有控件(WebForm中没有图表控件)显示图表,应该从基础信息生成并在创建PDF时嵌入。
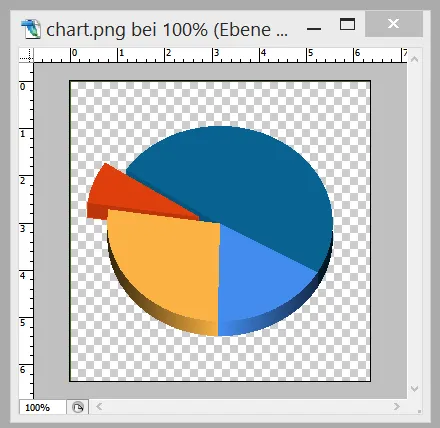
PDF和PDF生成的库已经就位。我想知道如何生成动态图表(条形图、饼图)3D或简单图表,而不需要放置图表控件,并能将其保存为带有透明背景的图像(.PNG)。原因是,PDF模板具有众多层次阴影,因此图像周围的背景应该是透明的,类似于下面的图像。
以下方法将为您提供具有平滑边缘的饼图,如图所示。
PDF和PDF生成的库已经就位。我想知道如何生成动态图表(条形图、饼图)3D或简单图表,而不需要放置图表控件,并能将其保存为带有透明背景的图像(.PNG)。原因是,PDF模板具有众多层次阴影,因此图像周围的背景应该是透明的,类似于下面的图像。

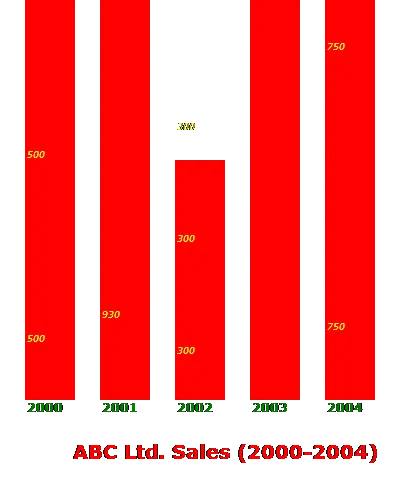
我尝试生成一个类似下面链接中的动态条形图,但是图片效果不太理想。
https://2leggedspider.wordpress.com/2004/11/21/generating-a-dynamic-bar-graph-using-aspnet-and-c/
更新:2016年3月16日星期三
有了TaW的答案和更新,我已经能够绘制所需的图表,以下是对我提出的同样问题的答案的更新
添加对System.Windows.Forms和System.Windows.Forms.DataVisualization的引用
添加以下命名空间
using System.Drawing;
using System.Windows.Forms;
using System.Windows.Forms.DataVisualization.Charting;
以下方法将为您提供具有平滑边缘的饼图,如图所示。

void Create3DPieChart()
        {
            /* Utilize the Chart class available in System.Windows.Forms.DataVisualization.Charting */
            Chart chart = new Chart();
            /* Add a chart area to the chart */
            ChartArea CA = chart.ChartAreas.Add("A1");
            /* Add data series to the chart and specify the type of Series */
            Series S1 = chart.Series.Add("S1");
            S1.ChartType = SeriesChartType.Pie;

            /* Assign points for the Series */
            S1.Points.AddXY(1, 17);
            S1.Points.AddXY(2, 27);
            S1.Points.AddXY(3, 7);
            S1.Points.AddXY(4, 49);

            /* Set chart color and other settings as required */
            chart.BackColor = Color.Transparent;
            CA.BackColor = chart.BackColor;
            CA.Area3DStyle.Enable3D = true;
            S1.Points[2]["Exploded"] = "true";

            /*Assign AntiAliasing to Graphics style for smooth edges*/
            chart.AntiAliasing = AntiAliasingStyles.Graphics;

            /* Set the image path and save the image as PNG format*/
            string imageNameAndPath = string.Concat(Application.StartupPath.Remove(Application.StartupPath.IndexOf("\\bin\\Debug")),
                                        "/TempImages/Image", DateTime.Now.ToString("ddMMyyyyhhmmss") + ".png");
            chart.SaveImage(imageNameAndPath, ChartImageFormat.Png);
        }