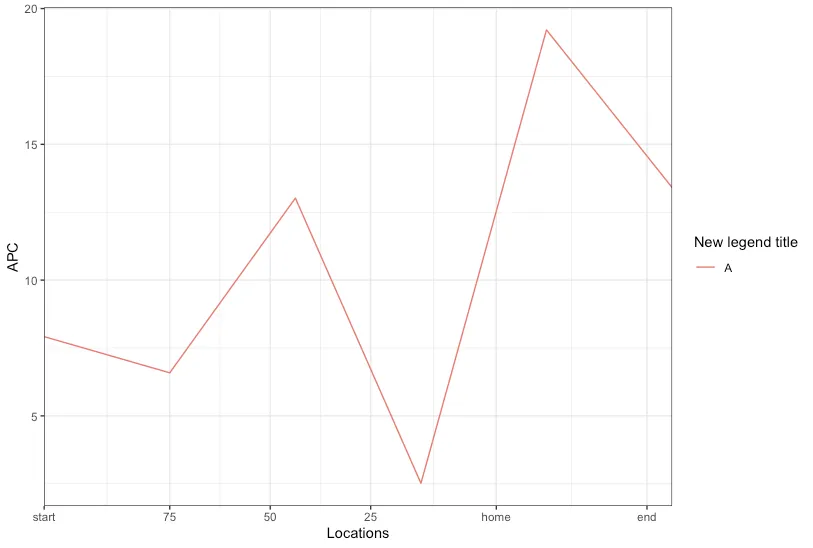
我试图删除“系列”图例,因为我添加了自己的图例(主要是为了更改图例标题)。
以下是我的代码(应该是可重复的)
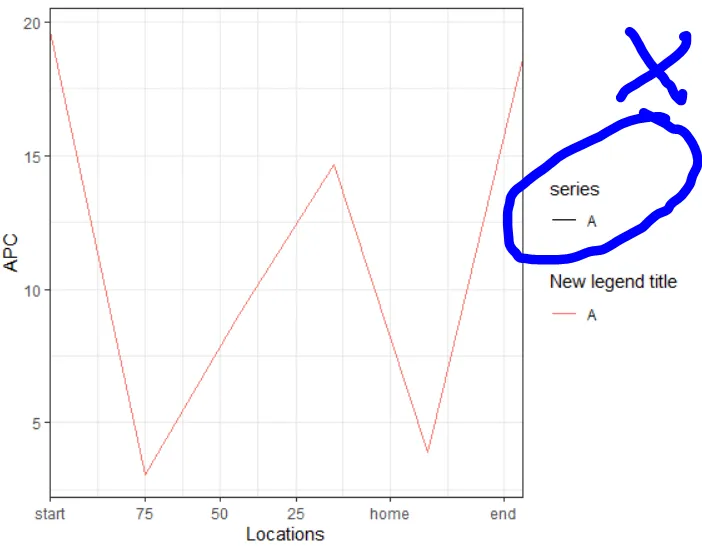
我尝试通过添加代码来移除系列图例:
但是这样做会同时移除两个标题,肯定有更简洁的方法。是否有人知道如何处理?
df<-data.frame(
  "time"=c(100, 75, 50, 25, 0, -25),
  "nativ"=c("start", "75", "50", "25","home","end"),
  "series"=c("A", "A","A", "A", "A","A"),
  "value"=runif(n = 6,min = 0,max = 20)
)

serlabel=c("start", "75", "50", "25","home","end")

p2<-ggplot2::ggplot(
  df,
  ggplot2::aes(time,
               value,
               group=1
  )) +
  ggplot2::geom_line(
    ggplot2::aes(colour = series, linetype=series))+
  #
  ggplot2::labs(x= "Locations",
                y="APC",
                colour=paste(
                  "New legend title")
  )+ #add variiable to function if fpkm or fc
  ggplot2::scale_x_reverse(breaks = c(100, 75, 55, 35, 10, -20),
                           labels = serlabel, #enter serieslabel variable
                           expand=c(0,0))+
  ggplot2::theme_bw()
p2
我尝试通过添加代码来移除系列图例:
+ggplot2::theme(legend.title = ggplot2::element_blank())
但是这样做会同时移除两个标题,肯定有更简洁的方法。是否有人知道如何处理?